Western Australia tops economic rankings as NT surges: CommSec State of the States

Queensland climbs to second as South Australia, Northern Territory show strongest momentum.

27 October 2025

State of the States graphic
  • Western Australia (WA) leads overall for the fifth consecutive quarter, topping four indicators.
  • Queensland rises to second, lifting above South Australia which slips back to third.
  • Northern Territory jumps from eighth to fourth - its best result since October 2016.
  • WA, South Australia (SA) and the Northern Territory (NT) show the fastest annual growth momentum.

Western Australia has again claimed the title of Australia’s best-performing economy, taking top place in the latest CommSec State of the States report.

Now in its 17th year, the quarterly report compares each state and territory across eight key indicators: economic growth, household spending, equipment investment, unemployment, construction work, population growth, housing finance, and dwelling commencements.

State of the States graphic

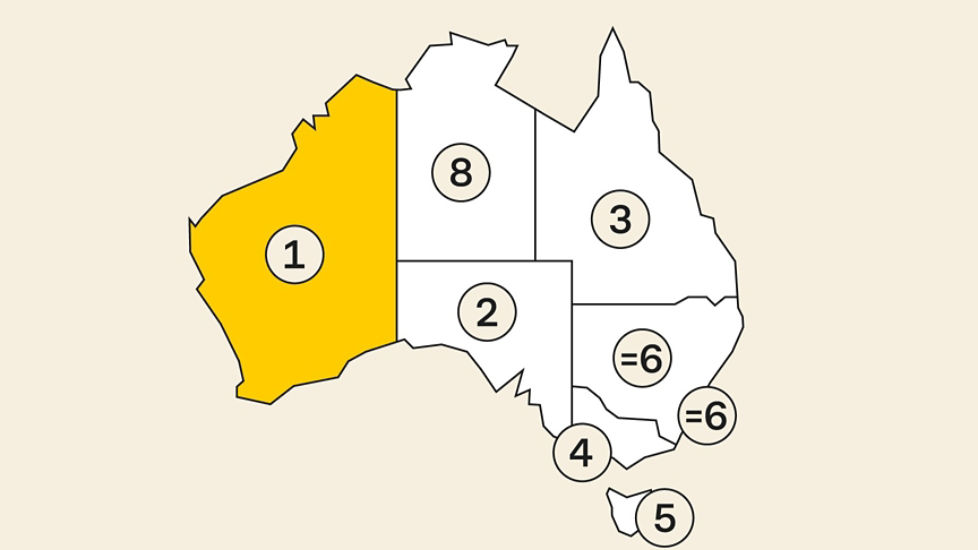
WA remains out in front

The overall rankings measure how each economy is performing relative to its own decade average or “normal” level of activity.

Western Australia leads for the fifth straight quarter, ranking first on household spending, housing finance, dwelling starts and equipment investment.

Queensland has climbed to second, supported by consumer spending and housing strength. South Australia holds third, leading in economic growth and construction activity.

The Northern Territory was the standout improver, jumping from eighth to fourth on the back of strong population growth. Interest-rate sensitive Victoria, Tasmania, NSW and the ACT follow as public demand moderates and private investment gathers pace.

“Western Australia continues to perform strongly, underpinned by strong population inflows, resilient household spending and ongoing government support,” said Chief CommSec Economist Ryan Felsman. 

“Queensland’s economy is rebounding following weather-related disruptions earlier in the year with exports stabilising, while the public investment outlook is promising in the Sunshine State due to planned Olympic infrastructure projects.” 

“Lower borrowing costs will eventually support the transition from public-to-private sector-led economic activity in Australia’s south-eastern states and territories,” said Felsman.

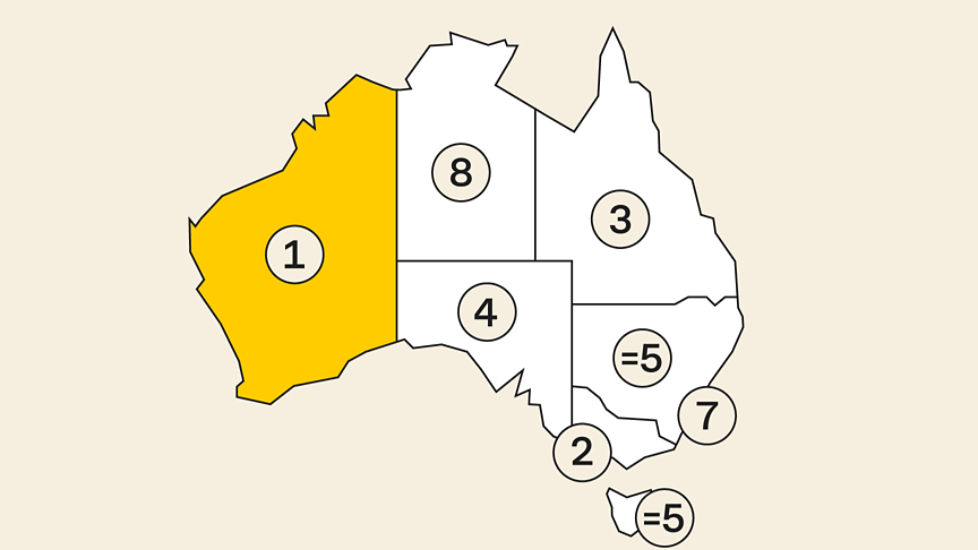
Growth accelerates in SA and NT

CommSec also tracks more recent economic momentum, the pace of annual growth across the same eight indicators.

On this measure, Western Australia again leads, closely followed by South Australia and the Northern Territory. These states are showing the strongest acceleration in private sector activity and spending growth.
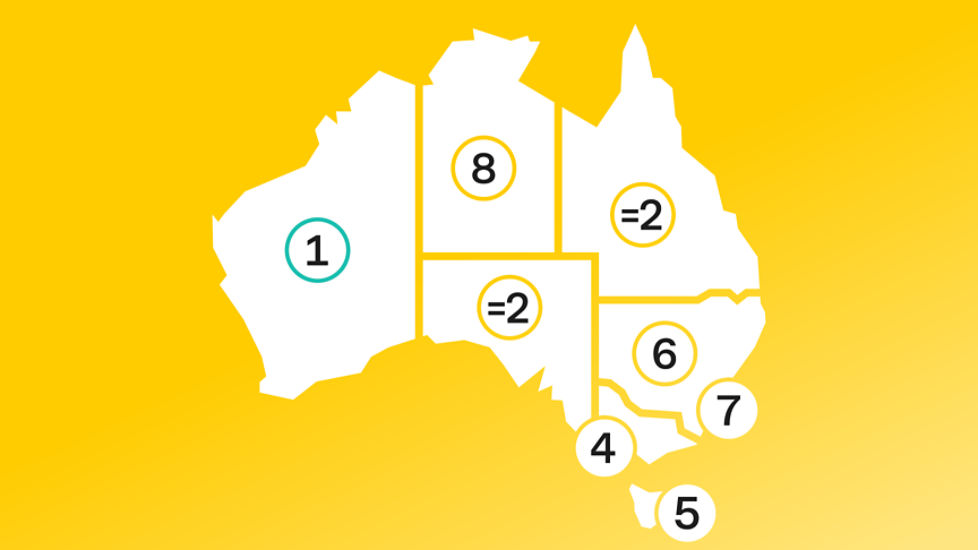
Outlook

Looking ahead, resource-driven states are expected to maintain their advantage into 2026 as easing inflation, lower borrowing costs and rising real wages support demand.

“Western Australia, Queensland and the Northern Territory are best positioned heading into 2026,” Felsman said. “The key question now is whether the private sector can sustain the recovery as public investment tapers off.”

State of the States graphic

Snapshot of Key Indicators

  • Economic Growth: South Australia leads, 8.7 per cent above its long-run average.
  • Household Spending: WA ranks first, 14.8 per cent above its long-term average.
  • Equipment Investment: WA leads, 32.9 per cent above the decade average.
  • Unemployment: Tasmania has the strongest job market, 25 per cent below its decade average.
  • Construction Work: South Australia remains top, 21.9 per cent above its decade norm.
  • Population Growth: The Northern Territory leads on relative population growth.
  • Housing Finance: WA tops again, 42.5 per cent above its long-run average.
  • Dwelling Starts: WA leads, 24.8 per cent above the decade average.

About the CommSec State of the States Report

The October 2025 edition of the State of the States report uses the most recent economic data available. While population growth data relates to the March quarter of 2025, other data – such as unemployment – is much timelier, covering the month of September 2025, with the majority of the other indicators using June quarter of 2025 figures. 

CommSec, the digital broking arm of Australia’s largest bank, assesses the performance of each state and territory on a quarterly basis using eight key indicators. Those indicators include economic growth, household spending, equipment investment, unemployment, construction work done, population growth, housing finance and dwelling commencements.

Just as the Reserve Bank of Australia (RBA) uses long-term averages to determine the level of "normal" interest rates, CommSec compares the key indicators to decade averages; that is, against "normal" performance.

CommSec also compares annual growth rates for eight key indicators for all states and territories, in addition to Australia as a whole, enabling a comparison of economic momentum.

Downloadable Assets

Read next

Fasten your seatbelt: making sense of a new economic era

We have entered a new economic era; one with rules that are very different to the last., writes CBA Chief Economist Luke Yeaman.

Newsroom

For the latest news and announcements from Commonwealth Bank.

Things you should know

Media releases are prepared without considering an individual reader’s objectives, financial situation or needs. Readers should consider the appropriateness to their circumstances. Visit Important Information to access Product Disclosure Statements or Terms and Conditions which are currently available electronically for products of the Commonwealth Bank Group, along with the relevant Financial Services Guide. Target Market Determinations are available here. Loan applications are subject to credit approval. Interest rates are correct at the time they are published and are subject to change. Fees and charges may apply.