Behind the top grouping of four economies is Western Australia, South Australia and NSW, followed by the Northern Territory.
Across Australia’s state and territory economies, governments are now managing the effects of ‘living with COVID-19‘, supporting consumers and businesses amid cost of living pressures, while at the same time scaling back stimulus measures.
The CommSec State of the States report uses the latest available information to provide an economic snapshot of each region by comparing annual growth rates for eight key indicators including: economic growth; retail spending; equipment investment; unemployment, construction work done; population growth; housing finance and dwelling commencements.
Speaking about the report, CommSec Chief Economist Craig James said there was little separating the country’s state and territory economies.
“Victoria may have moved to the top of the economic leader-board, but there is little to separate the top four economies,” Mr James said.
“Victoria leads the way on two of the eight economic indicators. But showing how even the rankings are, the ACT and South Australia also each lead other economies on two of the eight indicators.”
“When looking at annual growth to get a guide on economic momentum, Queensland had annual growth rates that exceeded the national average on all of the eight indicators.”
“In terms of future economic performance, much will depend on how economies are affected by growing COVID-19 case numbers and also how they respond to a period of rising interest rates.”
State and territory highlights
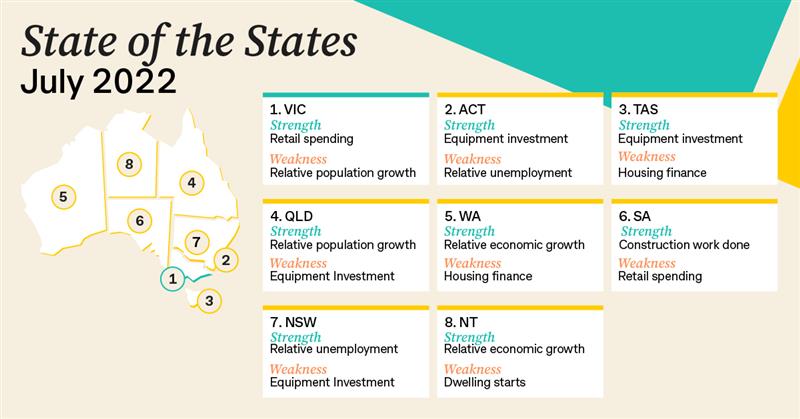
- Victoria ranked first on both retail spending and relative unemployment.
- NSW ranked third on relative unemployment.
- Queensland ranked first on relative population growth.
- South Australia ranked first on dwelling starts and construction work.
- Western Australia ranked first on relative economic growth.
- Tasmania ranked second on equipment investment.
- The ACT ranked first on equipment investment and housing finance.
- The Northern Territory ranked second on relative economic growth.
Annual growth rates
- Annual changes in economic indicators are useful for measuring economic momentum.
- Of the eight indicators assessed, four of the states and territories each recorded the fastest annual growth rates on two indicators, the outperforming economies being: Victoria, Queensland, the Northern Territory and the ACT.
- And notably, when looking across annual growth rates, Queensland’s growth rates exceeded the national average on all of the eight indicators.
- Next best were South Australia and Western Australia, exceeding the national annual growth rate on five of the eight indicators.
- Victoria leads the national average on four measures. Tasmania and the Northern Territory lead the national average on three indicators. The ACT was ahead of the national average on two indicators. And NSW exceeded the national average on just one indicator.