Commonwealth Bank analysis reveals the types of Australians most likely to donate to charities and the causes about which they are passionate.
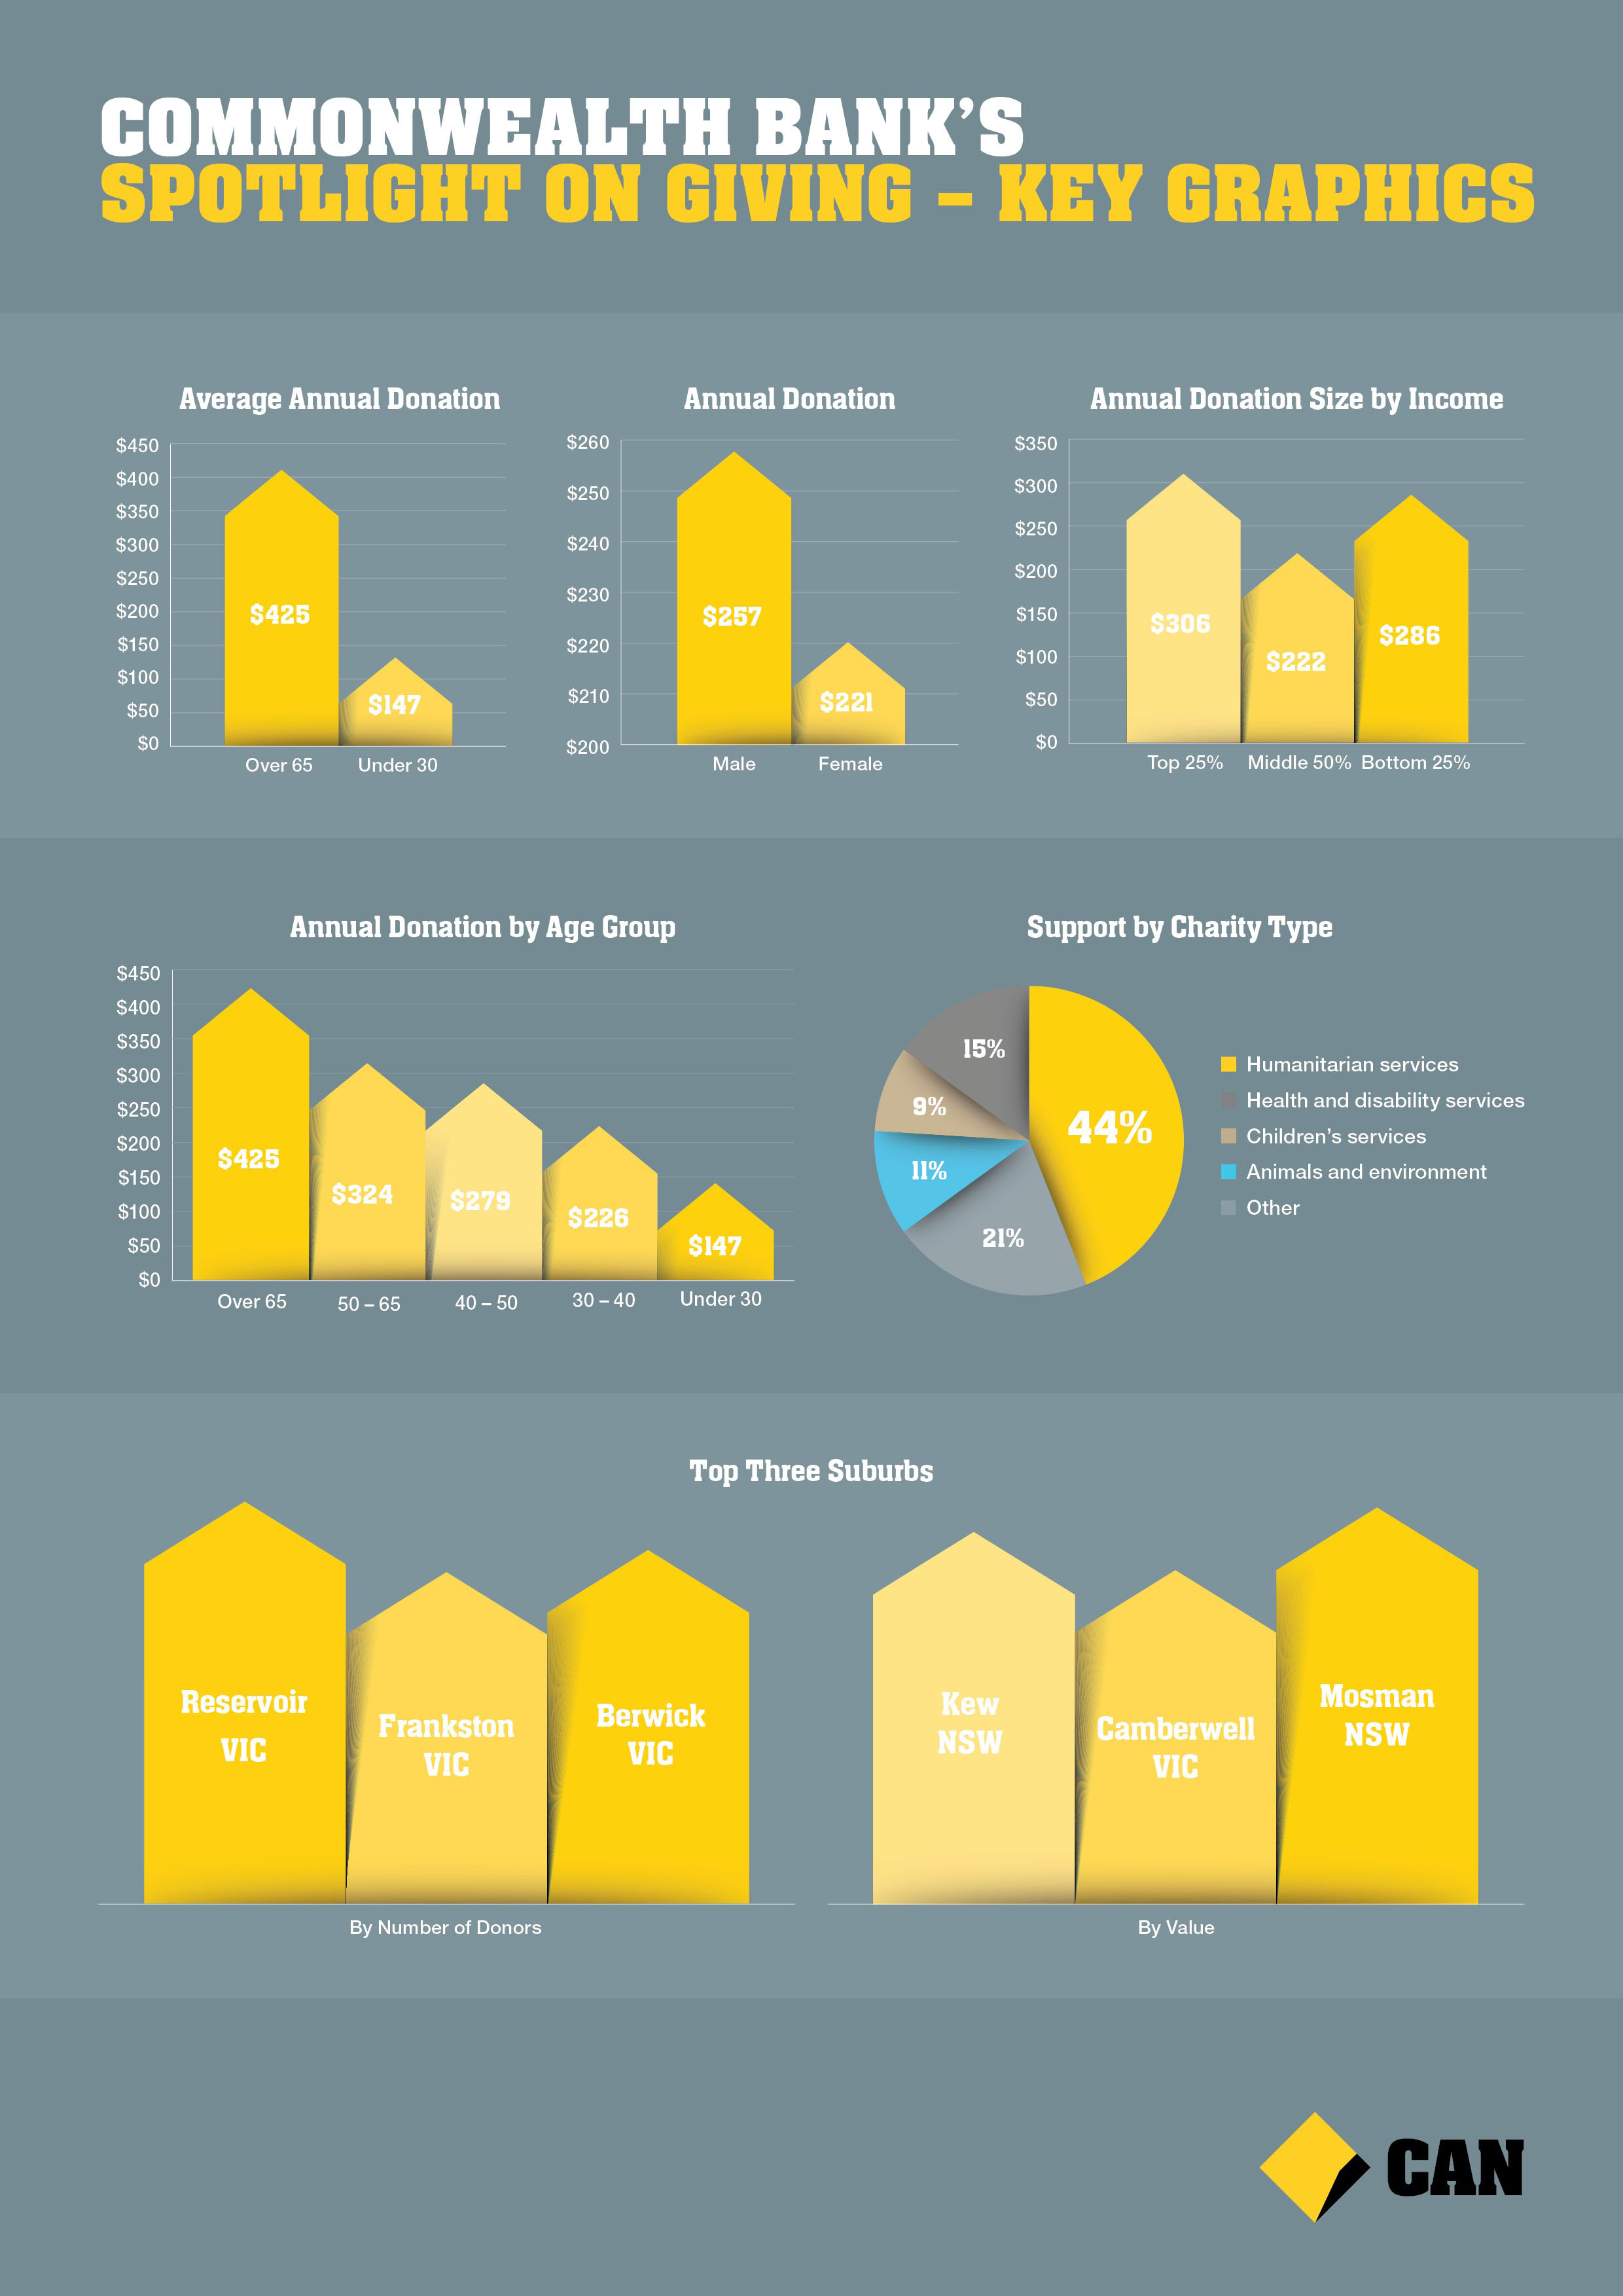
The research finds that those aged over 50 years are responsible for half of all donations while those aged over 65 give away the most in a year at $425 on average, compared to $147 for those aged under 30.
Females as individuals are more likely to give to charity than men but men provide slightly greater amounts when they do donate. The majority of donations come from couples and families.
And the types of charities which attract the most financial support are humanitarian services at 44 per cent of all donations, followed by health and disability services (21 per cent), children’s services (11 per cent) and animals and environment (9 per cent).
Commonwealth Bank Head of Not for Profit Sector Banking, Julienne Price, said the analysis provided rich insights into the charitable habits of Australians.
“The analysis is based on electronic payments made over a two-year period from 2013/2014 to 2014/2015 involving 18.5 million transactions by more than two million Commonwealth Bank customers to 185 charities,” she said.
“We found that customers who donate across several charity types generate more value for those organisations than those who donate to only one brand. A total of 11 per cent donate to more than five brands, generating 33 per cent of the total value.”
“There is virtually no difference in the population share and donation values from State to State but the analysis found that Queensland recorded the greatest donation value increase from one year to the next. And rural and regional centres recorded greater charitable growth than metropolitan centres over the study period.”
In fact, the top three suburbs by number of donors were all in Victoria at Reservoir, Frankston and Berwick, while the top three suburbs by value were Mosman in NSW followed by Victoria’s Camberwell and Kew.
“Many of our NFP clients are looking for insights and advice to help them with the various challenges they face which of course includes fund-raising and this analysis can really help them,” Julienne said. “This is an example of using our very extensive data base to illustrate what’s happening in the market place to help our customers plan and work more effectively. Apart from the important demographic details, one insight we know from this data is that aggregators are responsible for eight per cent of all donations but just three per cent of the value, so potentially that represents an opportunity or challenge to increase the value derived from that source for charities.”
“We also found the average donation size is around $50 and that the winter months are the most popular time for donations. These sorts of insights can help charities better plan and target both existing and prospective donors in their fund raising efforts.”
Key study highlights:
Demographic breakdown of donation sizes
Demographic group |
Average donation size |
Annual donation |
Male |
$45 |
$257 |
Female |
$41 |
$221 |
Couple/family |
$54 |
$313 |
Retiree |
$46 |
$267 |
Income type |
Average donation size |
Annual donation |
Top 25% |
$53 |
$306 |
Middle 50% |
$41 |
$222 |
Bottom 25% |
$48 |
$286 |
Age breakdown |
Average donation size |
Annual donation |
Over 65 |
$55 |
$425 |
50-65 |
$49 |
$324 |
40-50 |
$49 |
$279 |
30-40 |
$45 |
$226 |
Under 30 |
$38 |
$147 |
State breakdown |
Customer numbers |
Donation value |
Qld |
20% |
20% |
NSW |
34% |
36% |
Vic/Tas |
29% |
28% |
NT/SA |
6% |
6% |
WA |
11% |
10% |


