


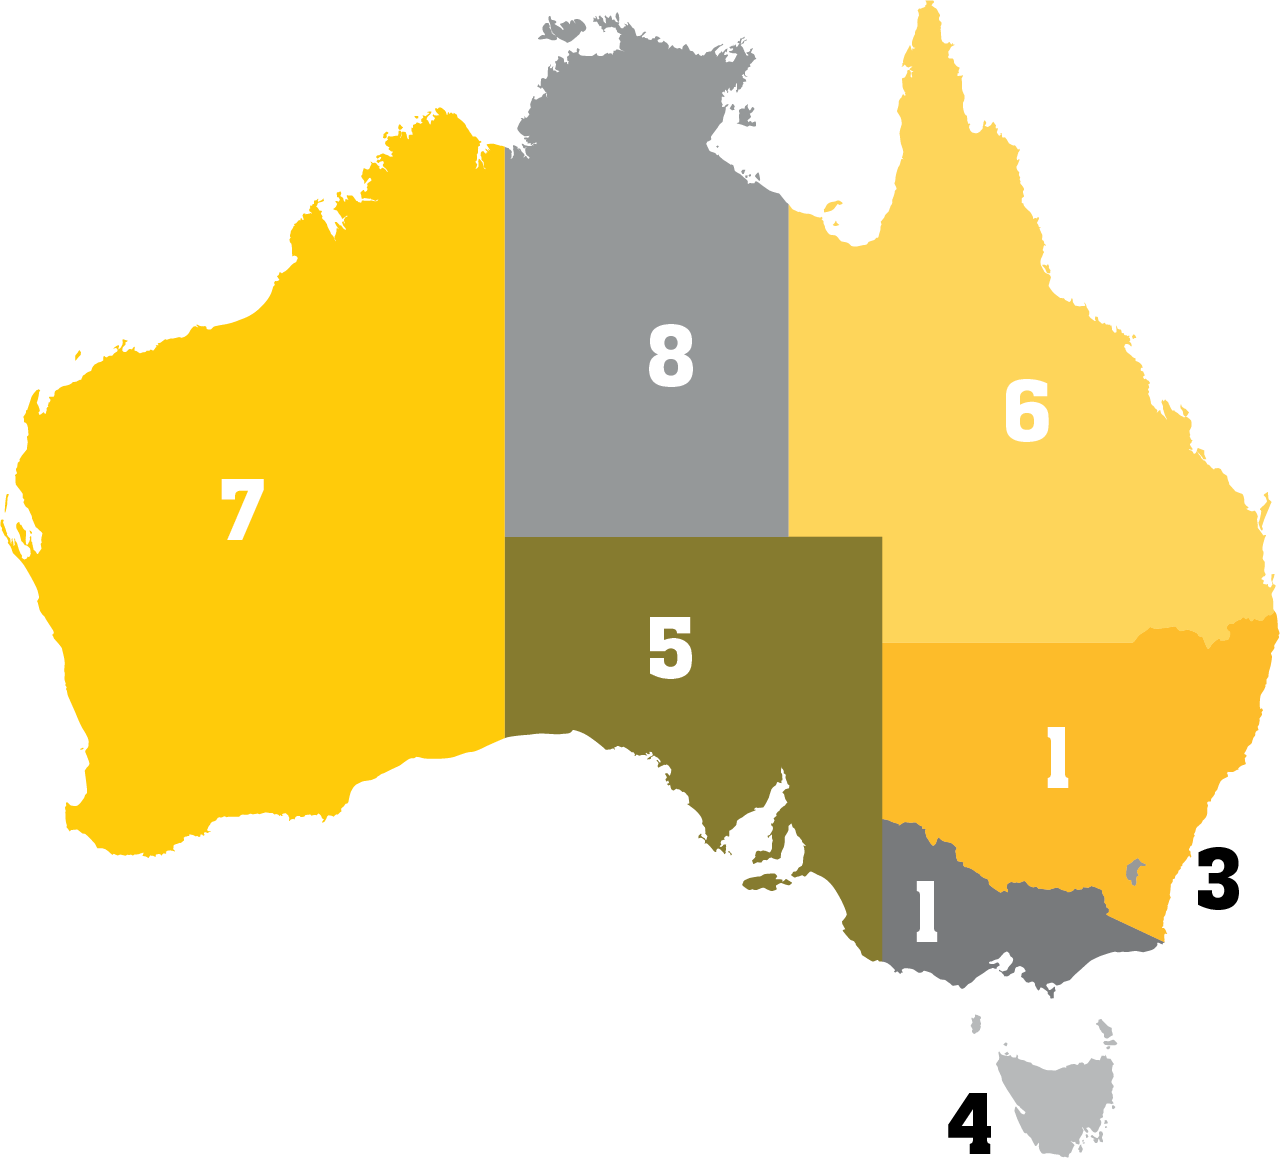
Solid population growth and strong job markets are driving retail spending and business investment, helping Victoria and New South Wales achieve joint-first position for economic performance nationally, according to the latest CommSec State of the States report.
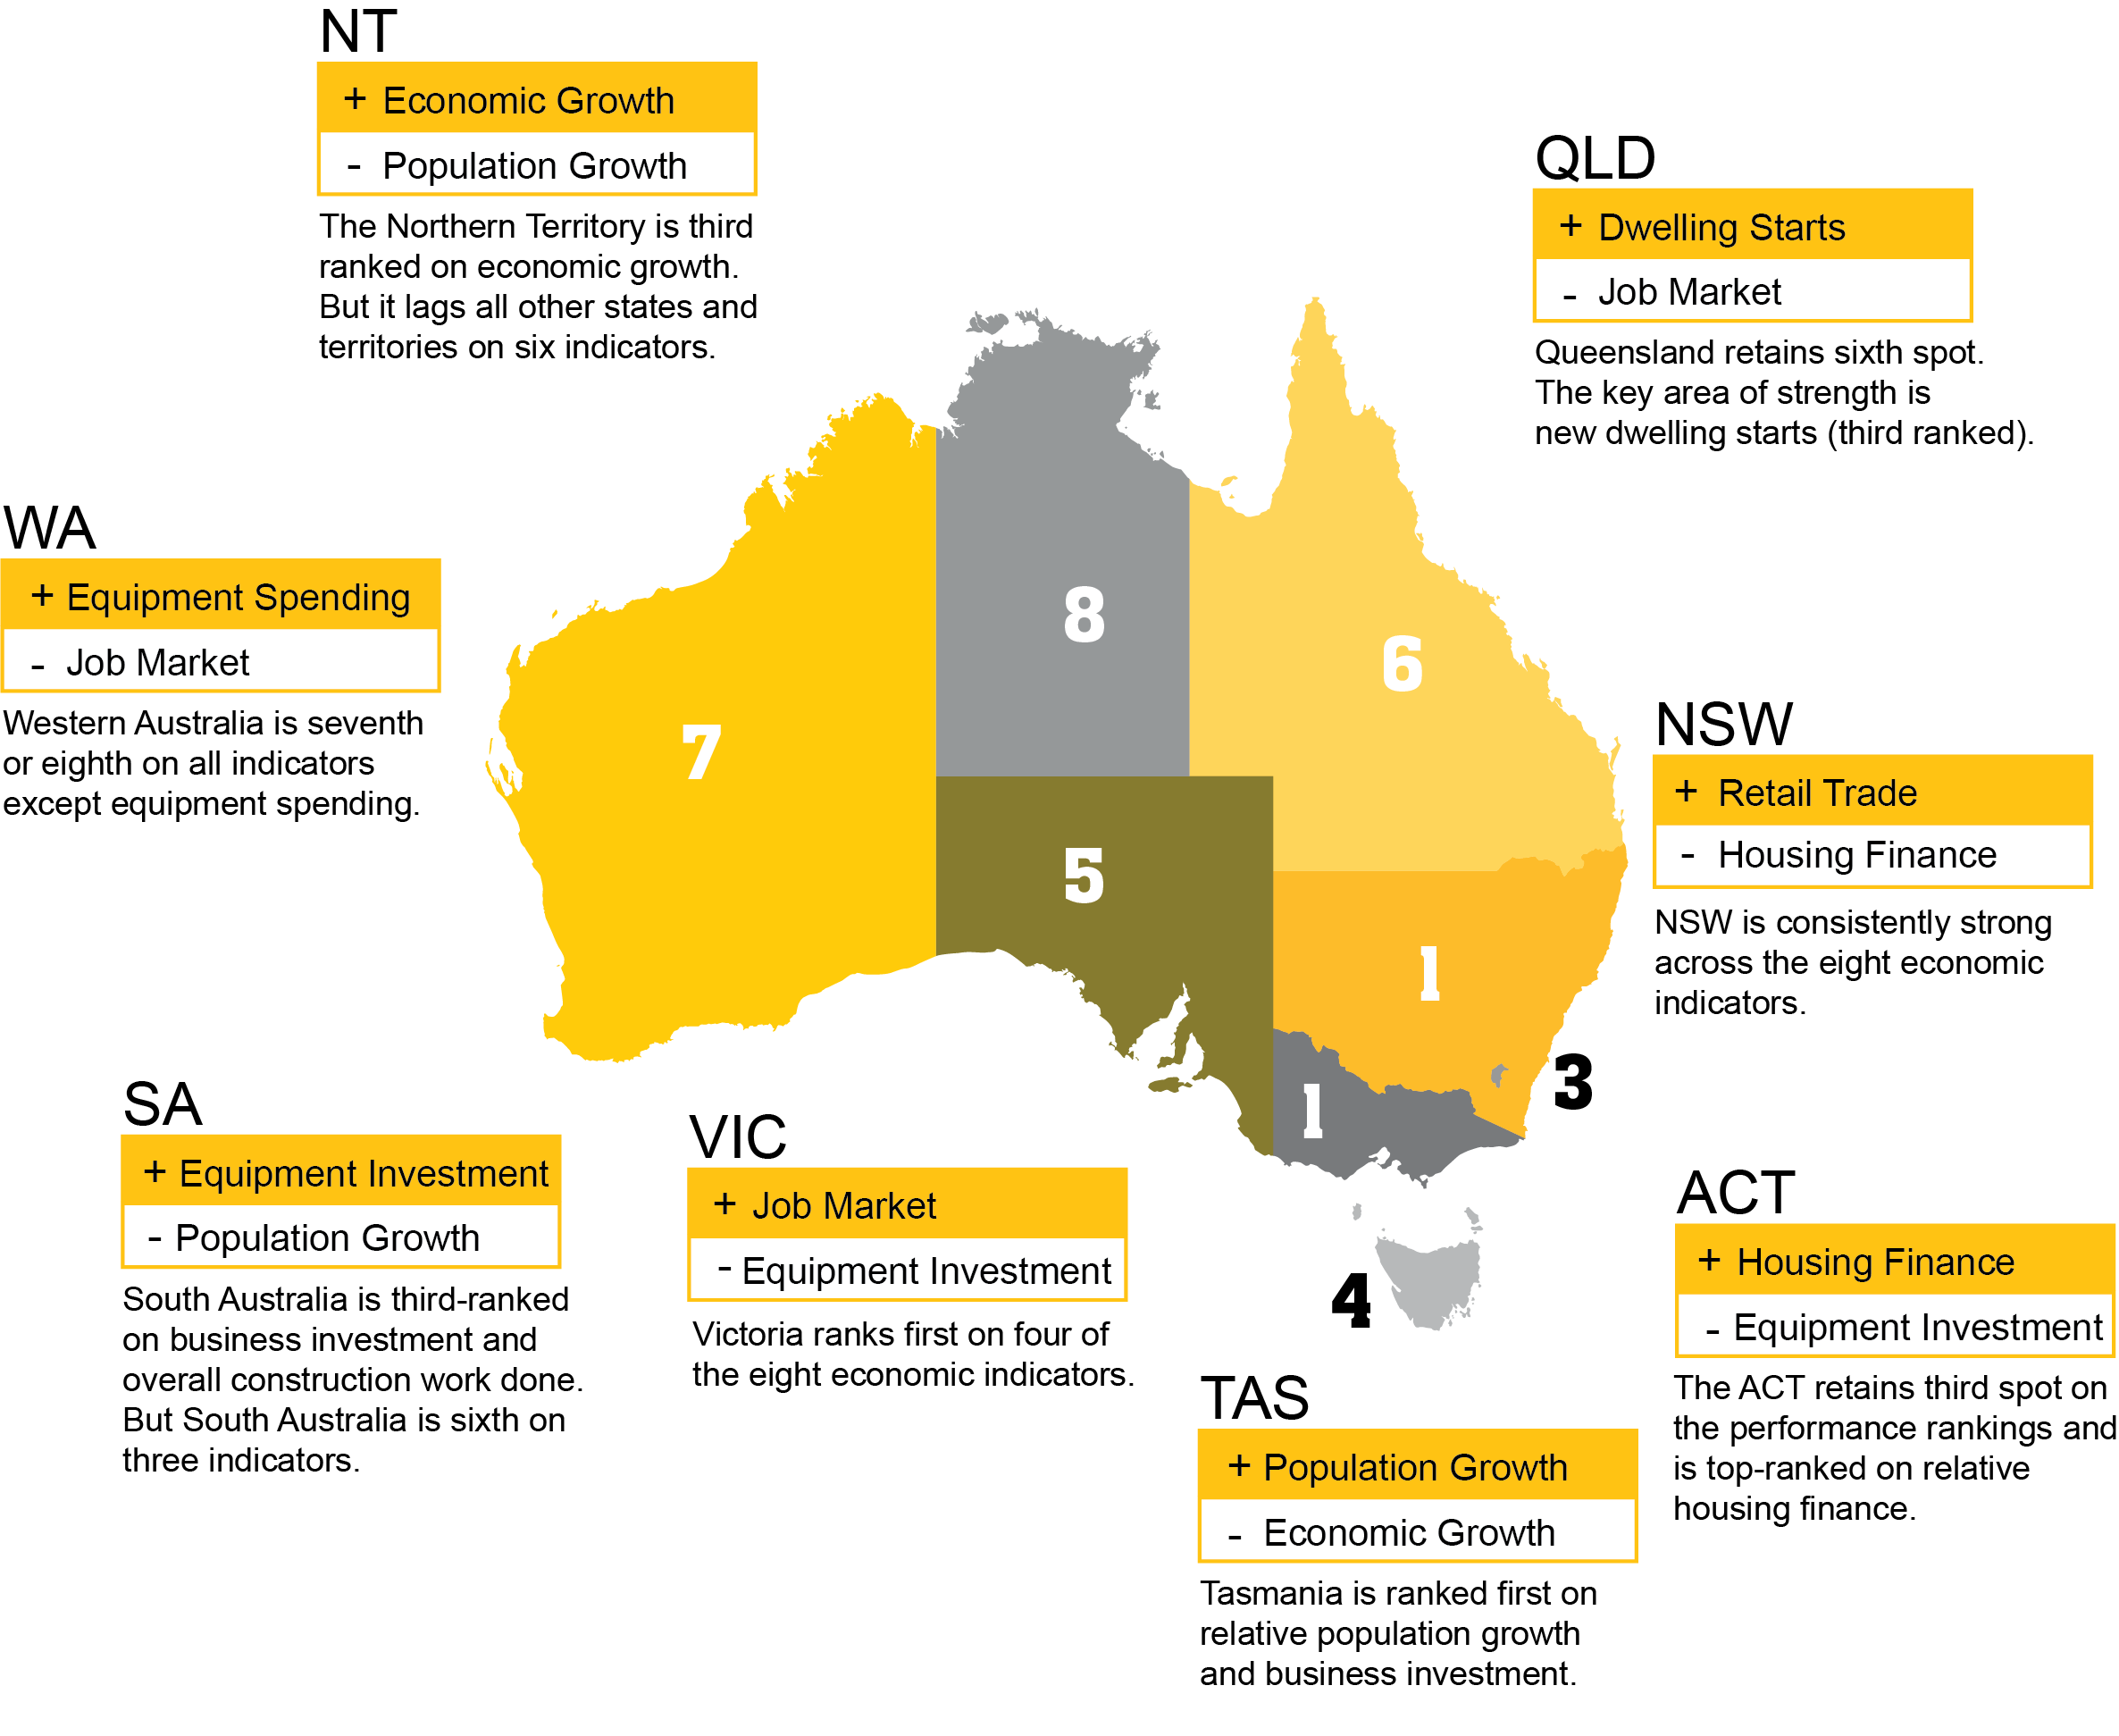
In the latest economic performance report, Victoria ranked first for four of the eight economic indicators assessed in the analysis (economic growth, retail spending, unemployment and construction work done) while New South Wales was consistently strong across all indicators and ranked second on six of the indicators.
New South Wales matched Victoria as joint leader with the Australian Capital Territory edging closer and retaining third spot. The Australian Capital Territory ranked first for dwelling starts and relative housing finance, followed closely by Tasmania, which retained the nation’s strongest outcome on relative population growth and spending on new manufacturing plant and equipment.
CommSec Chief Economist Craig James said: “When we compare the latest readings with decade averages, it remains a close race between Victoria and New South Wales. Victoria maintained top spot on relative economic growth and in New South Wales the trend unemployment rate of 4.3 per cent hasn’t been bettered in monthly records going back to 1978.”
This is the third and sixteenth time respectively that Victoria and New South Wales have taken the top spot since CommSec introduced the report in October 2009.
Comparing annual economic growth rates, Tasmania topped growth on four measures (economic growth, equipment investment, housing finance and construction work) and Victoria on two (retail trade and population). The Australian Capital Territory led on one measure (home starts). The Australian Capital Territory exceeded the national average on seven of the eight indicators used in the analysis, while Tasmania led on six and New South Wales and Victoria on four.
Findings in detail:
1. Victoria
Victoria remained Australia’s best-performing economy for a third consecutive quarter. Victoria also secured top position for retail sales from New South Wales. Retail spending in Victoria was 18.1 per cent above decade average levels in the September quarter and was the strongest in terms of annual growth (up 4.2 per cent).
“Victoria has held on to the number one position for three consecutive quarters, this time sharing the top spot with New South Wales. Victoria has seen strong retail spending, supported by the fastest absolute annual population growth, low unemployment and solid construction work,” Craig said.
2. New South Wales
New South Wales climbed back to the top position (equal with Victoria) after ranking second for the previous two quarters. With no individual top spots, the state achieved six second position rankings out of eight indicators, in addition to being ranked third on population growth and fifth in housing finance.
“In New South Wales the trend unemployment rate of 4.3 per cent hasn’t been bettered in monthly records going back to 1978. Annual employment growth is strong at 2.9 per cent.,” Craig said.
“With above-normal population growth, New South Wales also experienced record-high construction work, sitting 34.5 per cent above the decade-average for the state.”
3. Australian Capital Territory
The Australian Capital Territory held its third spot in the national performance rankings, edging closer to Victoria and New South Wales. The Australian Capital Territory was again top-ranked on relative housing finance (with the number of commitments up by 32.8 per cent on the long-term average) and also took the top spot for dwelling starts from New South Wales (88.5 per cent in trend terms above Australian Capital Territory decade-averages). Dwelling starts had the biggest move on the individual indicator rankings, moving up significantly from sixth position in the previous survey.
“The Australian Capital Territory is experiencing relative strong population growth at 12.6 per cent above the decade average – second ranked for the nation – and this is clearly an important driver of the broader economy, especially retail spending and housing demand,” Craig said.
4. Tasmania
Tasmania remained in fourth position and held its number one spots for relative population growth (sitting almost 90 per cent above the decade-average levels) and equipment investment (up 35.7 per cent on the decade-average levels). The biggest change in the individual rankings was a drop from third to fifth position on dwelling starts.
“Tasmania is strongest on the pace of economic growth, with the state’s economy growing by 6.9 per cent in nominal terms over the year to September,” Craig said. “The state also saw the strongest wage growth across the nation in the year to September – up by 2.6 per cent.”
5. South Australia
South Australia retained its fifth position courtesy of firm business investment and construction work, both ranked third nationally. “The total real value of residential, commercial and engineering work completed in trend terms in the September quarter across South Australia was at record highs, with construction work done 19.5 per cent above the decade-average,” Craig said.
South Australia improved its relative positions on equipment spending and housing finance but was also in sixth position for economic growth, population growth and dwelling starts.
6. Queensland
Queensland couldn’t close the gap with South Australia, keeping sixth place, and positioning sixth on four of the eight economic indicators: retail spending, housing finance, unemployment and construction work done. The state was ranked seventh on equipment investment.
“The key area of strength in Queensland is new dwelling starts that now sit in third spot nationally, with starts up 20 per cent on decade averages,” Craig said.
7. Western Australia
Western Australia has lifted from eighth to seventh on the performance rankings. But Western Australia continues to face challenges and ranked seventh or eighth on all indicators, except equipment spending (sixth position) which has been growing in annual terms for 18 months. The state has the second weakest job market, as well as the weakest relative positions on construction work and economic growth.
Economic activity in Western Australia in the September quarter was just 6.7 per cent above its decade average. , Western Australia also has the second weakest job market of all states and territories, as well as the weakest level of construction work done (40.6 per cent below the decade-average in the September quarter).
“There are some encouraging signs for Western Australia. Although population growth is below decade-averages, it is growing at the fastest rate in almost three years. While spending on plant and equipment is down 7 per cent on the decade average, it is up on a year ago and at near four-year highs,” Craig said.
8. Northern Territory
The Northern Territory eased from seventh to eighth on the economic performance rankings, grouping broadly with Western Australia. Both continue to face challenges with the transition of resources projects moving from the production to the export phase. The Territory ranked eighth on six of the eight economic indicators (unemployment, retail spending, equipment investment, population growth, housing finance and dwelling starts) and ranked third on economic growth, up 23.5 per cent on the decade average.
“The Northern Territory population shrank by 0.1 per cent over the past year. This is the first time this has happened in 15 years and is clearly an important driver of the economy,” Craig said.
The Northern Territory recorded the weakest result on retail spending, up 4.0 per cent on the decade average, as well as the weakest equipment spending, down 33 per cent on the decade average. The Territory also saw the slowest annual population growth, down 107.4 per cent on decade averages. It also remained the weakest for housing finance with trend commitments 27.7 per cent lower than its decade average, as well as the lowest dwelling starts - 46.4 per cent below decade-averages.
“The good news is that dwellings commenced in the territory lifted in the September quarter after hitting near 30-year lows in the June quarter,” Craig said.
About the State of the States Report
CommSec, the online broking arm of Australia’s largest bank, assesses the performance of each state and territory on a quarterly basis using eight key indicators. Those indicators include:
- economic growth,
- retail spending,
- equipment investment,
- unemployment,
- construction work done,
- population growth,
- housing finance, and
- dwelling commencements.
Just as the Reserve Bank uses long-term averages to determine the level of "normal" interest rates, CommSec compares the key indicators to decade averages, that is, against "normal" performance. CommSec also compares annual growth rates for eight key indicators for all states and territories, in addition to Australia as a whole, enabling a comparison of economic momentum.
Read the latest CommSec State of the States report.