


Strong construction activity and the lowest unemployment rate in a decade helped Victoria retain its top spot for economic performance nationally, ahead of NSW for a second consecutive quarter, according to the latest CommSec State of the States report.
In the latest economic performance report, Victoria ranked first for three of the eight economic indicators assessed in the analysis (economic growth, unemployment and construction work done), taking the top spot for only the second time since CommSec introduced the report in October 2009.
With little to separate the two economies and coming in second overall, NSW held its relative position on most indicators, maintaining two top rankings in retail spending and dwelling starts. The ACT took third spot, being top-ranked on relative housing finance, followed closely by Tasmania, with the Apple Isle achieving the nation’s strongest relative population growth and highest spending on new manufacturing plants and equipment.
CommSec Chief Economist Craig James said: “Victoria continues to outperform overall, although it remains a close race with NSW. Victoria retained top spot with construction work at almost 39 per cent above the decade average. These high levels of home building, along with strong population growth and employment growth, supported retail spending across the state, sitting at more than 17 per cent above decade-average levels.”
Comparing annual growth rates, Tasmania outperformed other states and territories on four growth measures (economic growth, equipment investment, housing finance and home starts). Victoria exceeded the national average on all eight indicators used in the analysis while Tasmania lead on five and NSW and the ACT on four.
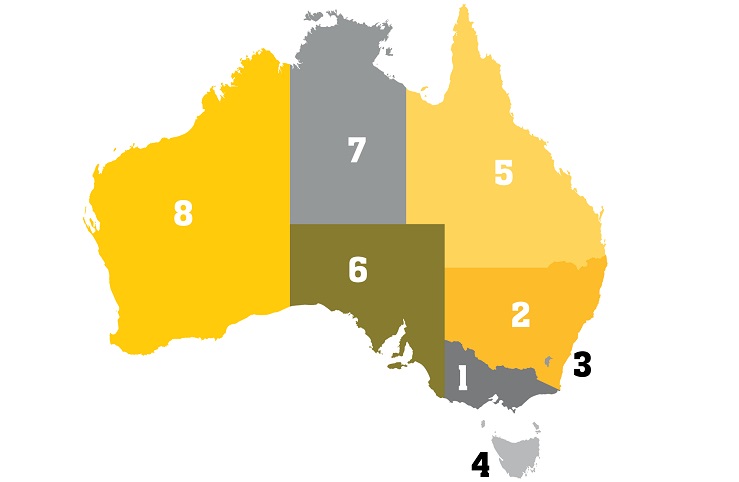
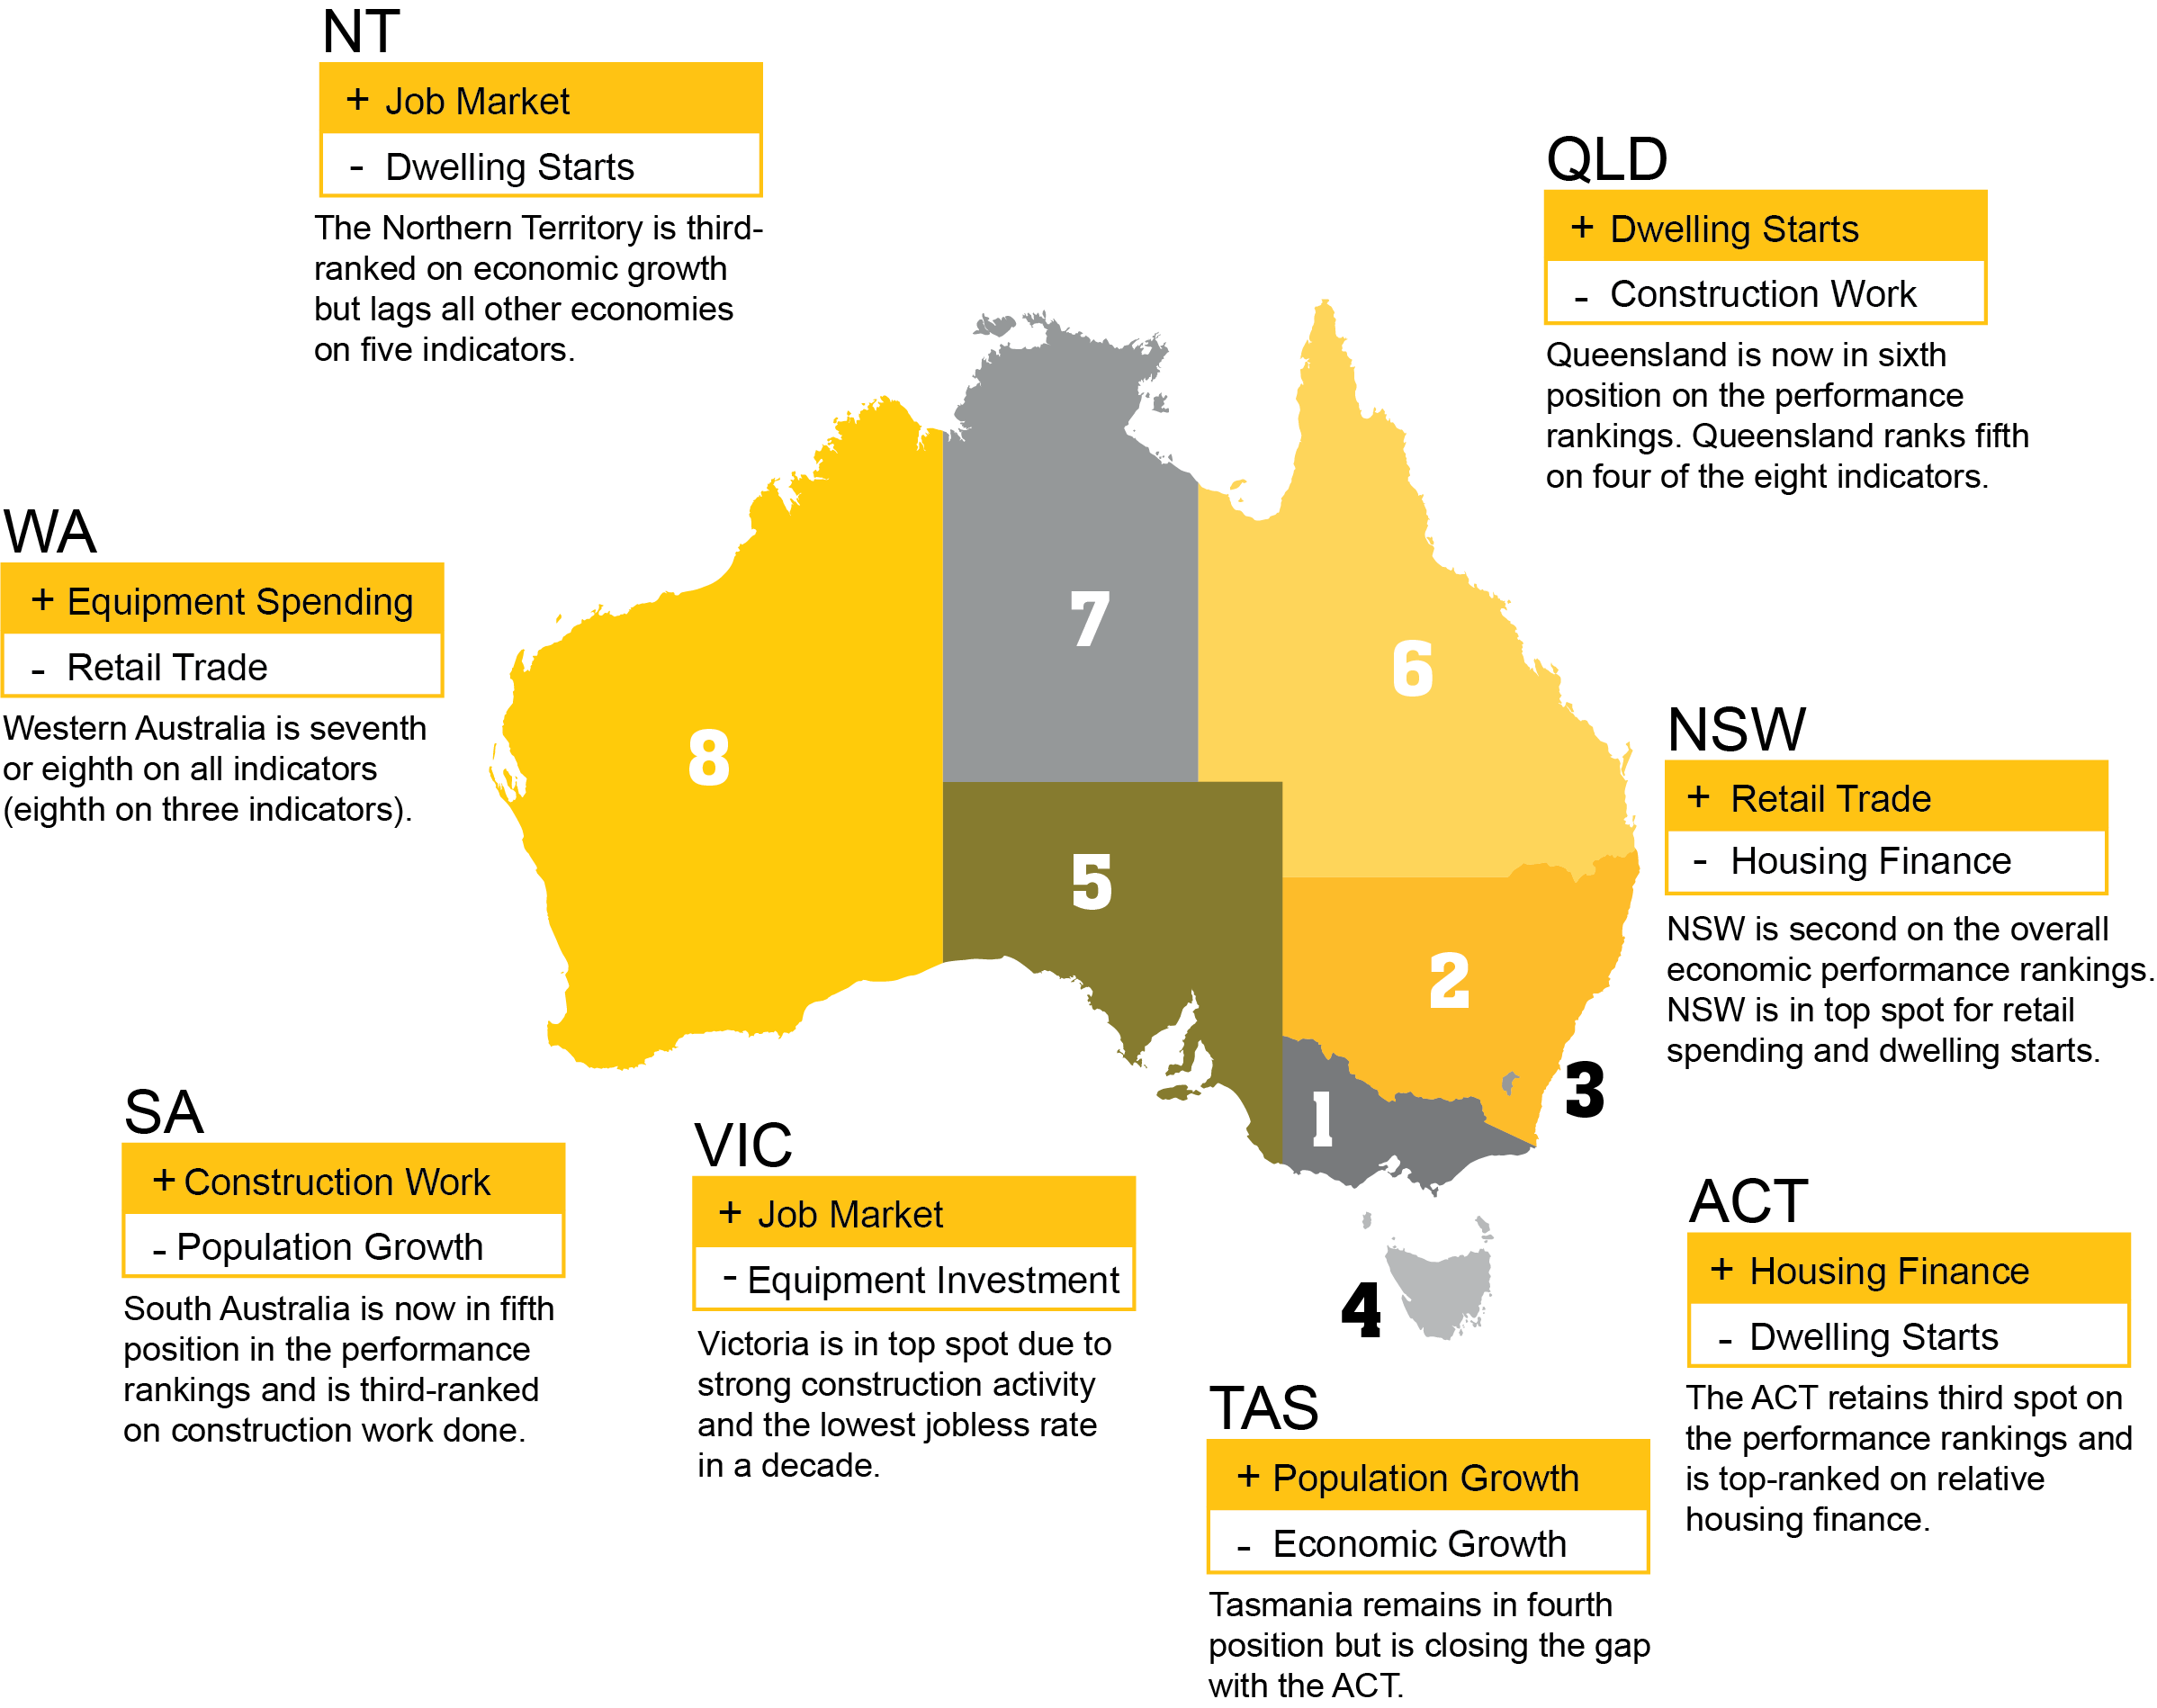
Findings in detail:
1. Victoria
Victoria is Australia’s best performing economy for the second consecutive quarter, ranking first on three economic indicators: economic growth, unemployment and construction work done. The state has the strongest job market in the nation, with trend unemployment at 17.4 per cent below the decade average. Victoria also has the strongest construction activity with work done almost 39 per cent above its decade average, and the strongest relative economic growth with economic activity 26.7 per cent above its decade-average level of output.
“Victoria secured the number one spot in terms of economic performance across Australia for a second consecutive quarter. This was aided by maintaining number one positions on relative economic growth and construction work done, while having the strongest job market in relative terms across the nation,” Craig said.
2. New South Wales
NSW maintained second position in Australia’s economic performance rankings, holding its relative position on most economic indicators. The state still holds the top spots for retail spending and dwelling starts.
“Solid home building due to ‘above-normal’ population growth, low unemployment, increased job security and infrastructure building are key supports for retail spending. NSW maintained the top spot on the retail rankings, sitting at 18 per cent above decade-average levels in the June quarter, and extended its lead over Victoria. NSW has also taken back top spot for dwelling starts from Victoria, sitting 54.9 per cent above decade-averages,” Craig said.
“In NSW the trend unemployment rate equals the rate existing from January to April 2008, which is the lowest rate in monthly data back to 1978,” Craig said. NSW also follows Victoria for construction work done, sitting 31.4 per cent above the decade-average.
3. Australian Capital Territory
The ACT held on to its third spot in the national performance rankings. The state is top-ranked on relative housing finance (with the number of commitments up by 19.2 per cent on the long-term average) and second-ranked on population growth and equipment investment (with population growth 9.3 per cent above the decade average).
“The ACT continues to have the lowest trend unemployment rate in the nation at 3.6 per cent, supporting the broader economy” said Craig.
4. Tasmania
Tasmania remains in fourth position and continues to rank No.1 for relative population growth. The state also took first spot for equipment investment – up 40.2 per cent on the decade average – and is now in second spot for housing finance, moving past Victoria with housing commitments up 15.4 per cent on decade averages.
“Tasmania is strongest on the relative population measure, with its 1.02 per cent annual population growth rate almost 78 per cent above the decade-average rate,” said Craig. “Tasmania continues to benefit from strong local economic growth, with the Apple Isle’s economy growing by 7.1 per cent in nominal terms over the year to June. And looking at a year ago, equipment investment in Tasmania was up the most nationally, by 58.5 per cent and at 9-year highs in trend terms,” Craig said.
5. South Australia
South Australia moves up from sixth to fifth postion after swapping positions with Queensland, but there is still little to separate the two economies. Construction work done was at record highs in the June quarter, up 23.4 per cent on a year ago and sitting 8.5 per cent above decade averages.
“Unemployment in South Australia has sat at 6-year lows for the past four months in trend terms,” said Craig.
6. Queensland
Queensland slipped to sixth place and has been ranked fifth on four of the eight economic indicators: population growth, home loans, dwelling starts and overall economic growth.
“Annual population growth rate in Queensland is 5.5 per cent below the decade average, but in absolute terms the 1.7 per cent annual rate is third strongest in the nation, “ said Craig.
7. Northern Territory
The Northern Territory retains its seventh position on the economic performance rankings and can be broadly grouped with Western Australia. Both continue to face challenges with the transition of resource projects moving from the production to the export phase. The Northern Territory is third-ranked on economic growth (up 25.6 per cent on the decade average) but lags all other states and territories on five indicators.
“A low jobless rate in absolute terms remains a key plank of support for the Northern Territory” said Craig.
The Northern Territory recorded the weakest result on retail spending, up 5.5 per cent on the decade average, as well as the weakest equipment spending, down 2.9 per cent on a year ago. The territory also saw the slowest annual population growth, up just 0.12 per cent on a year ago and down 90.9 per cent on decade averages. It also remains the weakest for housing finance with trend commitments 29.7 pr cent lower than its decade average.
8. Western Australia
Western Australia continues to face challenges. The state still has the weakest job market, as well as the weakest relative positions on construction work and economic growth, and ranks seventh on all other indicators.
Economic activity in Western Australia in the June quarter was just 8.0 per cent above its decade average. While on a 20-year average, Western Australia still has the weakest job market of all states and territories. The employment rate of 6.1 per cent is over 20 per cent above the 5.1 per cent decade average.
“The trend jobless rate in Western Australia has fallen for the past months. In addition there are encouraging signs for mining, tourism and regional housing markets,” said Craig.
About the State of the States Report
CommSec, the online broking arm of Australia’s largest bank, assesses the performance of each state and territory on a quarterly basis using eight key indicators. Those indicators include:
- economic growth,
- retail spending,
- equipment investment,
- unemployment,
- construction work done,
- population growth,
- housing finance, and
- dwelling commencements.
Just as the Reserve Bank uses long-term averages to determine the level of "normal" interest rates, CommSec compares the key indicators to decade averages; that is, against "normal" performance. CommSec also compares annual growth rates for eight key indicators for all states and territories, in addition to Australia as a whole, enabling a comparison of economic momentum.
Read the latest CommSec State of the States report.