Spending across the Australian economy rose at a solid 0.7 per cent trend pace in December, according to the first major economic reading of the holiday period released by the Commonwealth Bank today.
The monthly Business Sales Indicator (BSI) – a key measure of economy-wide spending – shows spending growth to be well ahead of the long-term average monthly growth pace of 0.4 per cent.
“It’s still early days, but spending plans are healing,” said CommSec Chief Economist and BSI author Craig James.
“Go back six months and consumers and business were hit by Brexit fears and election inertia. With those issues out of the way, there is scope now for a recovery in spending, especially with interest rates and inflation both so low.”
Over the first eight months of 2016, spending rose at only a 0.3 per cent monthly average trend pace. But since September – with the federal election and Brexit vote in the background – spending has averaged growth of 0.8 per cent a month.
Annual trend growth in sales rose from 5.2 per cent to 5.4 per cent in December – the strongest annual growth in nine months.
The more volatile seasonally adjusted BSI fell by 0.1 per cent in December after rising by 2.8 per cent in November and falling by 0.3 per cent in October.
“The latest sales data is encouraging, suggesting the economy started the new year with solid momentum,” said Craig James.
Sector analysis
In December, 17 of the 19 industry sectors analysed expanded in trend terms, a similar outcome to October and November.
Sales dipped slightly at Retail Stores, down by 0.2 per cent in December while spending at Mail Order/Telephone Order Providers fell by 3.2 per cent.
On the other side of the equation, one of the strongest gains occurred in Business Services, up 1.9 per cent in December after a 2.3 per cent increase in sales in November. In the Service Providers sector, spending also rose by 1.9 per cent in December after a 2.0 per cent gain in November.
Other notable trend increases in sales occurred in Automobiles and Vehicles (up 1.6 per cent), Hotels and Motels, Wholesale Distributors and Manufacturers and Miscellaneous Stores (all up 1.1 per cent).
In annual growth, only one of the 19 industry sectors contracted over the past 12 months: Mail Order/Telephone Order Providers (down 2.1 per cent).
At the other end of the scale, sectors with strongest annual growth included Amusement and Entertainment (up 16.4 per cent), Hotels and Motels (up 14.9 per cent), Wholesale Distributors and Manufacturers (up 13.5 per cent) and Government Services (up 13.4 per cent).
State by state breakdown
The Australian Capital Territory saw the strongest growth in spending, up 1.9 per cent on the previous month. In annual growth, the ACT was also equal strongest with South Australia at 11.4 per cent.
Sales were stronger in all states and territories in December except Victoria, which was down 0.5 per cent. Following the ACT was Tasmania (up 1.3 per cent), followed by New South Wales and South Australia (up 1.2 per cent), Western Australia (up 0.9 per cent), Queensland (up 0.7 per cent) and the Northern Territory (up 0.6 per cent).
Spending has consistently increased in Queensland for 68 months, for 67 months in Western Australia and for 65 months in South Australia.
In annual terms all states and territories had sales above a year ago except Victoria, which was down 2.5 per cent. Strongest growth was South Australia and ACT, both up 11.4 per cent, Western Australia (up 8.5 per cent), NSW (up 7.7 per cent), Tasmania (up 7.2 per cent), Queensland (up 6.8 per cent) and Northern Territory (up 3.7 per cent).
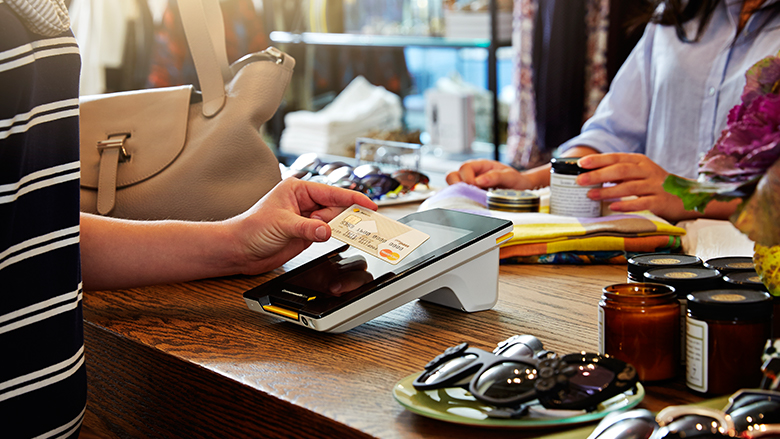
The BSI tracks the value of credit and debit card transactions processed through Commonwealth Bank point-of-sale terminals.
Find out more about the latest Commonwealth Bank Business Sales Indicator
About the Commonwealth Bank Business Sales Indicator
The Commonwealth Bank Business Sales Indicator (BSI) is calculated by tracking the value of credit and debit card transactions processed through Commonwealth Bank merchant facilities throughout Australia.
The BSI has been devised to provide a monthly assessment of spending trends in the Australian economy (covering 19 industry sectors and all Australian states and territories) and is available to the public on the Bank’s website and to the media on or around the 20th day of each month.
Credit and debit card transactions can be volatile on a month-to-month basis, affected by seasonal and irregular factors. The BSI is tracked in seasonally adjusted and trend terms. The overall BSI is measured in both seasonally adjusted and trend terms while state/territory and industry data are measured using the less volatile ‘trend’ approach. The seasonally adjusted and trend estimates of the BSI results are derived by applying a statistical program.
The monthly BSI has been devised to provide a more timely assessment of spending trends in the economy. The main monthly indicator of spending in the economy is the Australian Bureau of Statistics’ (ABS) Retail Trade release. However these statistics only cover spending at retail establishments, and exclude spending at a raft of other businesses.
The BSI includes transactions made at traditional retail establishments such as supermarkets, clothing stores, cafes and restaurants and as such is more comparable to the ABS Household Final Consumption Expenditure, which is released on a quarterly basis. The BSI also covers businesses such as airlines, car dealers and utilities, such as water and electricity companies, as well as motels, business, professional and government services and wholesalers.
The BSI includes industry sectors based on the International Merchant Category Code (MCC) categories. MCC is a four-digit number assigned to a business when the business first starts accepting cards as a form of payment.


