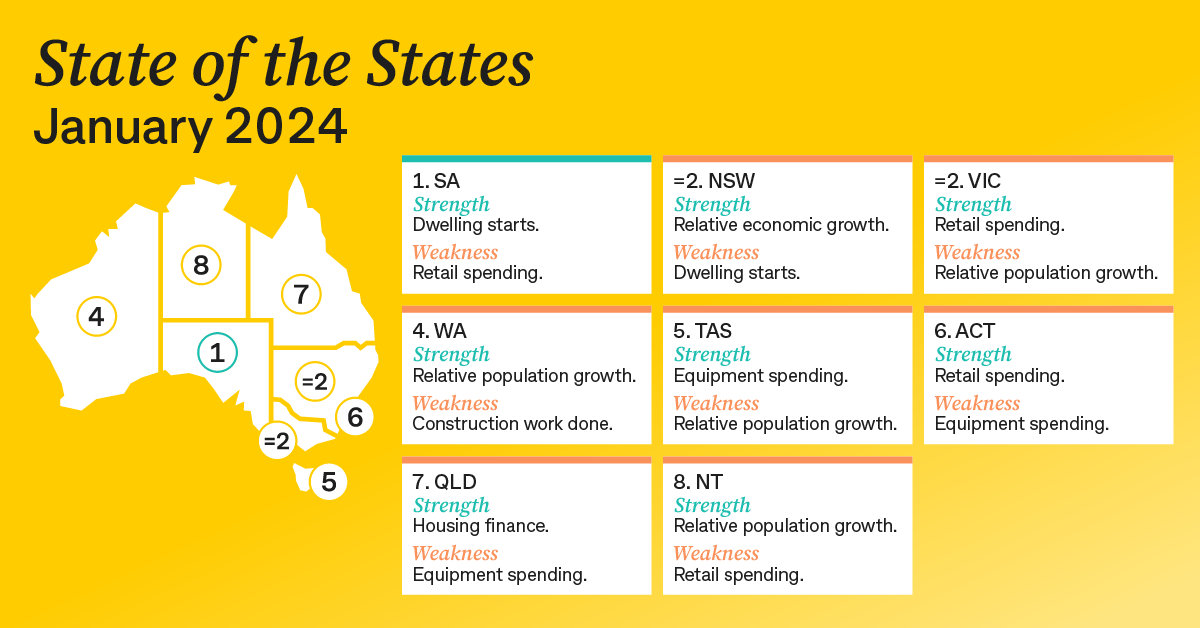
Construction activity and a strong job market have helped South Australia ascend to the top of the economic performance leaderboard, according to CommSec’s quarterly State of the States report. This is the first time South Australia has ranked No.1 in the report’s 15-year history.

South Australia took out the top spot on four of the report’s eight key economic indicators – real economic growth, unemployment, construction work and dwelling starts.

Downloadable assets

South Australia jumped ahead of Victoria to take first place. Victoria is now equal second with NSW. Western Australia has lifted from fifth to fourth. Tasmania rose from sixth to fifth. The ACT has moved into sixth, ahead of Queensland which has fallen three places from fourth to seventh. The Northern Territory is eighth.

“The economic performance of Australia’s states and territories is being supported by a solid job market and strong population growth however the economies have slowed in response to rising interest rates, higher borrowing costs and price pressures,” CommSec Chief Economist Craig James said

“For the first time in the history of our reports, South Australia has taken the lead. Population growth in South Australia has tripled over the past two years, which is showing up in a strong housing market and overall economic activity.

“However, South Australia can’t rest easily. It is likely the state will face challenges from NSW and Victoria in the period ahead. 

“We have also looked at annual changes in economic indicators as a useful measure of economic momentum and the report shows strong economic momentum by Western Australia, with Queensland, Victoria, NSW and South Australia not far behind.” 

The CommSec State of the States report uses the latest available information to provide an economic snapshot of each state and territory by comparing eight key indicators: economic growth, retail spending, equipment investment, unemployment, construction, population growth, housing finance and dwelling commencements.

State and territory highlights

  • South Australia ranked first on four indicators, including construction work done and unemployment.
  • Victoria ranked second or third on three of the eight indicators, including retail spending.
  • NSW also ranked second or third on four of the eight indicators, including unemployment.
  • Western Australia ranked first on relative population growth.
  • Tasmania ranked first on equipment spending.
  • The ACT ranked first on retail spending.
  • Queensland ranked first on home loans.
  • The Northern Territory ranked second on relative population growth.
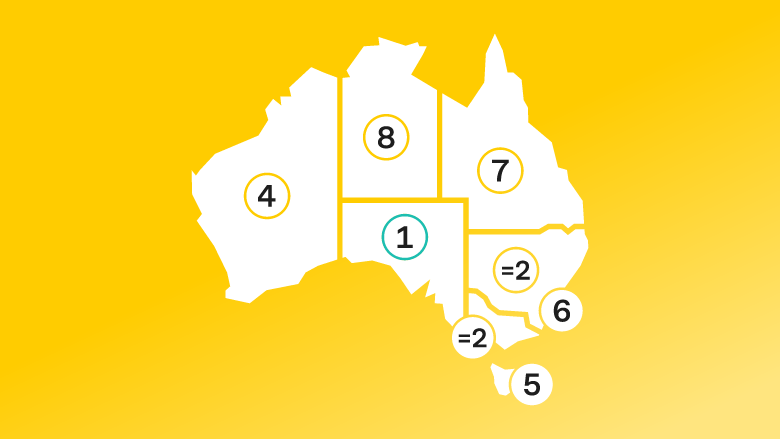
State of the States January 2024 snapshot shows SA is the No.1 state. Its strength is dwelling starts and its weakness is retail spending. State of the States January 2024 snapshot

Annual growth rates

Annual changes in economic indicators are useful for measuring economic momentum.

  • Western Australia has the strongest economic momentum, unchanged from the October 2023 survey ranking.
  • Queensland is in second position ahead of Victoria and NSW is in fourth spot.
  • South Australia is in fifth position ahead of the Northern Territory in sixth position, the ACT in seventh and Tasmania is in eighth position.
  • Western Australia leads other states and territories on annual growth rates on three of the eight indicators. 
  • The Northern Territory leads on two indicators. And South Australia, Queensland, and the ACT lead on one indicator.

Note to editors: interviews with Craig James can be requested via the CBA Media team on (02) 9118 6919 or media@cba.com.au.

About the CommSec State of the States Report

The State of the States report uses the most recent economic data available, however while some data relates to the March quarter (population), other data – such as unemployment – is timelier, covering the month of September.

CommSec, the digital broking arm of Australia’s largest bank, assesses the performance of each state and territory on a quarterly basis using eight key indicators. Those indicators include: economic growth, retail spending, equipment investment, unemployment, construction work done, population growth, housing finance, and dwelling commencements.

Just as the Reserve Bank uses long-term averages to determine the level of "normal" interest rates, CommSec compares the key indicators to decade averages; that is, against "normal" performance. CommSec also compares annual growth rates for eight key indicators for all states and territories, in addition to Australia as a whole, enabling a comparison of economic momentum.

Go to CBA Newsroom for the latest news and announcements from Commonwealth Bank.

Things you should know

  • Media releases are prepared without considering an individual reader’s objectives, financial situation or needs. Readers should consider the appropriateness to their circumstances. Visit Important Information to access Product Disclosure Statements or Terms and Conditions which are currently available electronically for products of the Commonwealth Bank Group, along with the relevant Financial Services Guide. Target Market Determinations are available here. Loan applications are subject to credit approval. Interest rates are correct at the time they are published and are subject to change. Fees and charges may apply.

  • Get in touch

    Journalists can email media@cba.com.au or call us on (02) 9118 6919

  • Subscribe

    Subscribe to receive the latest CBA media releases and announcements, or unsubscribe to stop receiving emails from CBA Newsroom

  • Follow us on X

    Follow Commonwealth Bank news via @CBANewsroom