Monthly Household Spending Intentions – September 2020
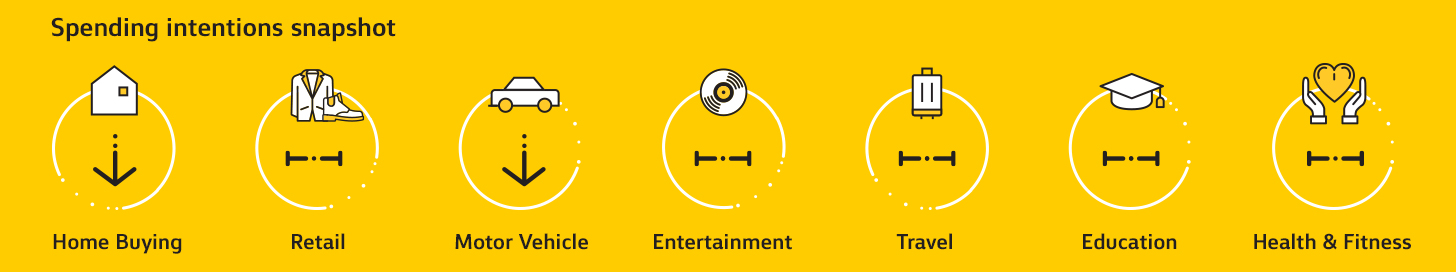
Each month, analysis by CBA’s Global Economic and Markets Research team provides an early indication of spending trends across seven key household sectors in Australia. In addition to home buying, the series covers around 55 per cent of Australia’s total consumer spend across; retail, travel, education, entertainment, motor vehicles, and health and fitness.
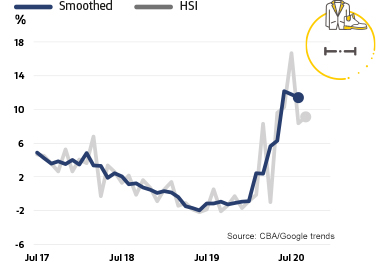
Retail Spending Intentions
- Retail Spending Intentions largely tracked sideways in September, coming off the highs seen pre-Melbourne shut-down in July.
- Retail Spending Intentions were, however, mixed across different categories during September. Gains were seen in spending in department stores, grocery stores, furniture & household equipment and appliances, paint & hardware stores, school and office supplies.
- Weakness in September was most evident in spending intentions in duty free stores, men’s clothing, shoe stores, beauty & barber shops.
- Whilst accounting for a small share of overall spending, outsized gains continue to be seen in spending intentions on arts & crafts supplies, apps, electronic stores, hobby, toy & games stores and record stores.
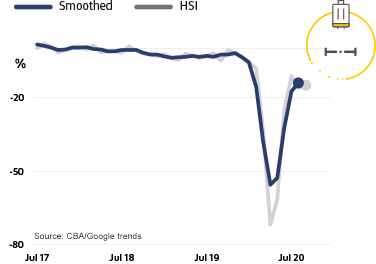
Travel Spending Intentions
- After bouncing sharply off their lows of April in recent months, Travel Spending Intentions tracked sideways in September.
- In the month, ongoing recovery was seen in visits to aquariums, camper & recreational vehicle dealers and trailer parks/camp grounds.
- Weakness remains evident in key areas such as airlines, hotels, motels & resorts, motor home & recreational vehicle hire, sport & rec camps, cruise lines, timeshare, tourist attractions, travel agents, car rentals and bus lines.
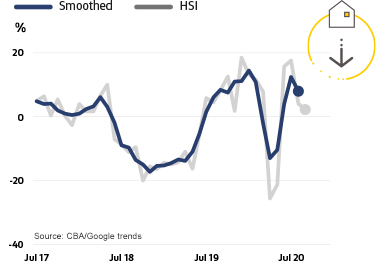
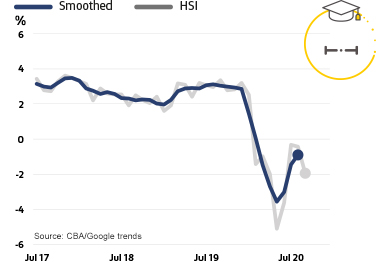
Home Buying Spending Intentions
- Home Buying Spending intentions were marginally lower in September, continuing the small decline evident in August.
- Although the number of home loan applications seen in September 2020 were higher than September last year, there has been a decrease on the month. In addition, Google searches declined marginally in September, as they had the previous month.
- But the RBA’s substantial easing of monetary policy has seen mortgage rates fall to multi-generational lows and we expect these low interest rates to continue to provide support to home buying. We expect house prices to show a peak-to-trough decline of -6%, but with substantial deviation expected across the capital cities.
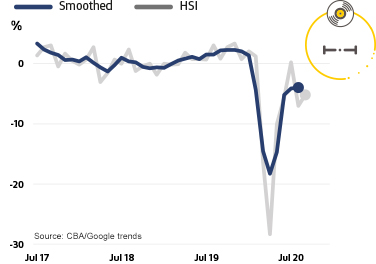
Education Spending Intentions
- Education Spending Intentions moderated a little in September, with both the value of transactions and the number of Google searches down.
- Over the year to September, both the number and value of total education spending is down, but with the number down more than the value.
- Year to September, softness remains evident in both the number and value of transactions for spending on business & secretarial schools and trade & vocational schools. While the number of spending transactions on colleges and universities is down, the value of these transactions is up a little.
Entertainment Spending Intentions
- Whilst well up from their lows of April, Entertainment Spending Intentions were also little changed in September.
- Spending intentions were led lower in September by declines in drinking out, art galleries, dance halls, movie theatres and live performance theatres and ticket sales.
- Some strength in September was seen in off-premise alcohol sales, fast food and confectionary sales, bowling alleys, pay-TV, digital books, movies, games & music and video games.
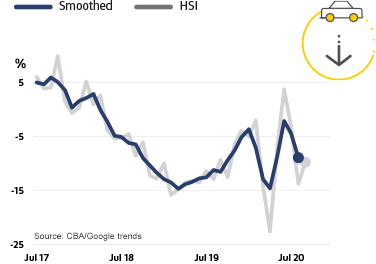
Motor Vehicles Spending Intentions
- Motor Vehicle Spending intentions lost momentum again in September, coming back down off their COVID-19 highs seen in June.
- While both the number of personal loan applications and value of motor vehicle transactions increased marginally in September, the number of Google searches was down on the month.
- A less weak outlook for residential property prices should help the outlook for the motor vehicle sector. Generally spending on motor vehicles has the highest response to changes in property prices according to research done by the Reserve Bank of Australia.
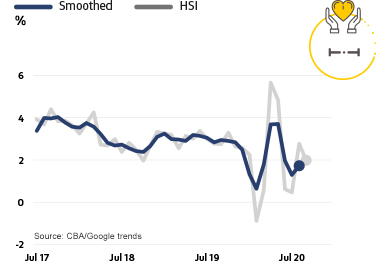
Health & Fitness Spending Intentions
- Health & Fitness Spending Intentions also tracked largely sideways in September and are now well off their highs seen early in the COVID-19 period.
- Within the health and fitness sector, spending intentions are mixed across the different categories. Improvement can be seen in spending intentions on chiropractors, dentists, optometrists and podiatrists.
- Large increases in spending intentions can also continue to be seen in bicycle shops – sales and service, golf courses and sporting goods stores.
Notes for Editors:
About our monthly Household Spending Intentions series
The HSI series offers a forward-looking view by analysing actual customer behaviour from CBA’s transactions data, along with household search activity from Google Trends.
The approach focuses on Australian households and their spending intentions. Employing near real-time spending readings from CBA’s household transactions data and combining them with relevant search information from Google Trends was used to map the data results on consumer spending. Households are the dominant part of the economy and drive much of its activity and volatility, and this combination adds to insights on prospective household spending trends in the Australian economy.
Google Trends is a publically available service that enables people to explore search trends around the world. These searches provide insights into what consumers are doing/researching on the Internet and what their spending intentions are.
CBA’s Household Spending Intentions series is published on the third Tuesday of every month. To find out more about the series, visit www.commbank.com.au/spendingintentions.
Disclaimer
The ‘CBA Household Spending Intentions’ series and “CBA credit and debit card spend” reports provide general market-related information, and are not intended to be an investment research report. These reports have been prepared without taking into account your objectives, financial situation (including the capacity to bear loss), knowledge, experience or needs. Before acting on the information in these reports you should consider the appropriateness and, if necessary seek appropriate professional or financial advice, including tax and legal advice. The data used in the ‘CBA Household Spending Intentions’ series is a combination of the CBA Data and Google Trends™ data. Google Trends is a trademark of Google LLC. Where ‘CBA data’ is cited, this refers to the Bank proprietary data that is sourced from the Bank’s internal systems and may include, but not be limited to, credit card transaction data, merchant facility transaction data and applications for credit. The Bank takes reasonable steps to ensure that its proprietary data used is accurate and any opinions, conclusions or recommendations are reasonably held or made as at the time of compilation of this report. As the statistics take into account only the Bank’s data, no representation or warranty is made as to the completeness of the data and it may not reflect all trends in the market. All customer data used or represented in this report is anonymous and aggregated before analysis and is used and disclosed in accordance with the Commonwealth Bank Group’s Privacy Policy Statement.
Commonwealth Bank of Australia ABN 48 123 123 124 AFSL 234945.
Full disclosures and disclaimers.