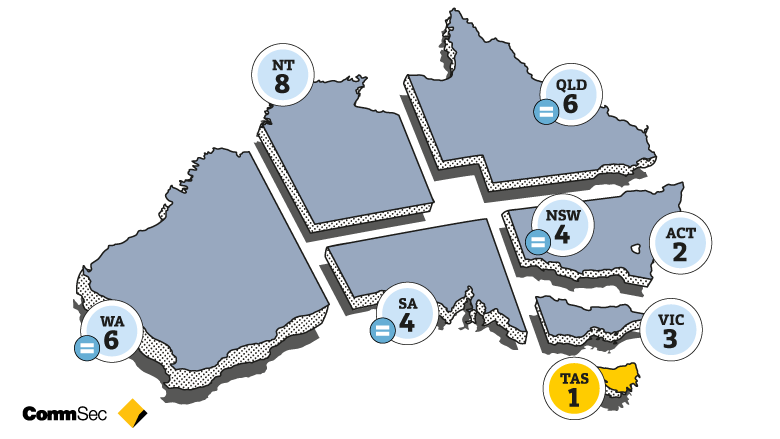
Monthly Household Spending Intentions – July 2020
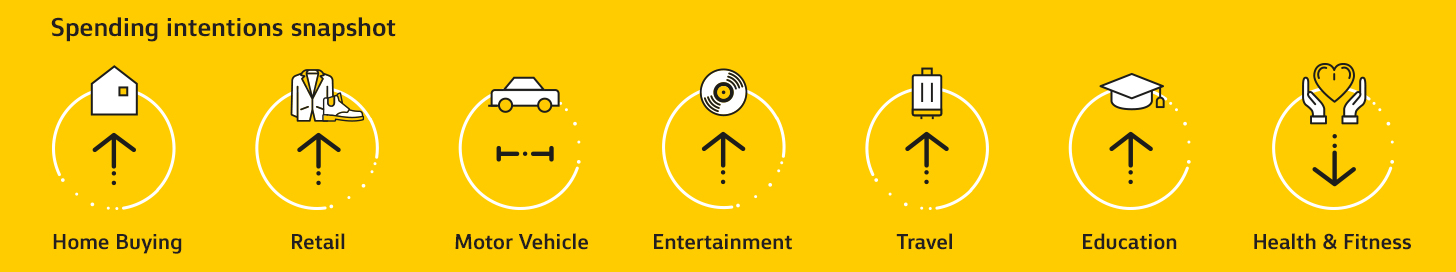
Each month, analysis by CBA’s Global Economic and Markets Research team provides an early indication of spending trends across seven key household sectors in Australia. In addition to home buying, the series covers around 55 per cent of Australia’s total consumer spend across; retail, travel, education, entertainment, motor vehicles, and health and fitness.
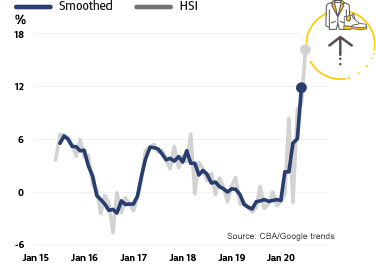
Retail Spending Intentions
- Retail spending intentions continued to rise in July. The improvement was driven by increased spending on food, general retail (including department & discount stores) and household furniture and equipment. Weakness is still evident in areas such as duty free stores, dry cleaners and tailors due to border closures and working from home requirements.
- Our weekly credit and debit card spending data shows that spending to 14 August was up 4%/yr, with clear evidence that the stage four restrictions in greater Melbourne are hurting household spending.
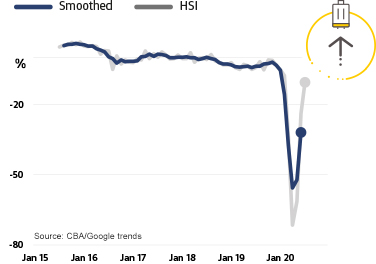
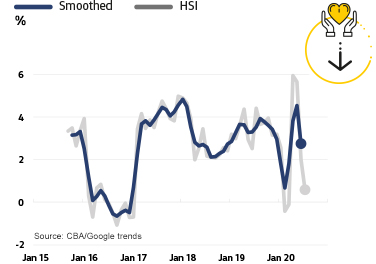
Travel Spending Intentions
- Travel spending intentions continued to bounce off their very low base set in April, with improvements in spending more than offsetting a decline in Google searches.
- With international borders likely to be closed for an extended period, this will continue to impact on travel spending intentions. We have noted in previous research that the loss of income from a collapse in international tourist arrivals could be (at least party) offset by a large increase in Australians holidaying at home. The exact offset will be dependent on inter-state border openings with most currently closed.
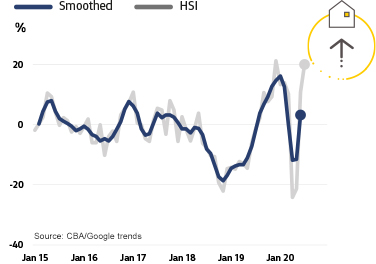
Home Buying Spending Intentions
- Home buying spending intentions improved further in July – and were almost back to the highs seen in late 2019. A combination of both an increase in home loan applications and Google searches were responsible for the gains.
- The RBA’s substantial easing of monetary policy has seen mortgage rates fall to multi-generational lows – especially for fixed rate mortgages. CBA data shows a rise in new mortgage applications taking advantage of low fixed rates and this should help provide support to home buying in the future.
- Stage 4 lockdown in Victoria, border closures and the resulting drop in the population growth rate are a clear source of downside risk to home buying.
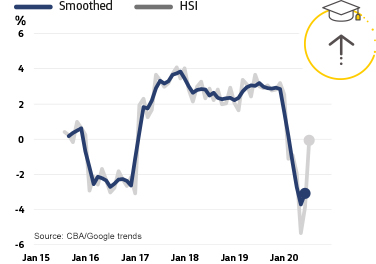
Education Spending Intentions
- Education spending intentions improved noticeable in July, recovering from sharp declines as the Covid-19 period began and schools, universities etc reverted to home-learning.
- Gains in Education spending intentions were especially seen in correspondence schools and trade & vocational education providers. Term 3 school fee payments could also be a factor here.
- Weakness remains evident, however, in the school sector and universities.
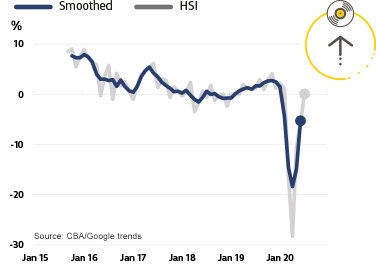
Entertainment Spending Intentions
- Entertainment spending intentions continued to recover lost ground in July.
- Increases in spending were seen across a number of categories, including fast food restaurants, alcohol stores, bowling alleys, pay TV, digital entertainment and music stores.
- Significant weakness can still be seen in massage parlours, art galleries, live music, dance halls/schools and movie theatres.
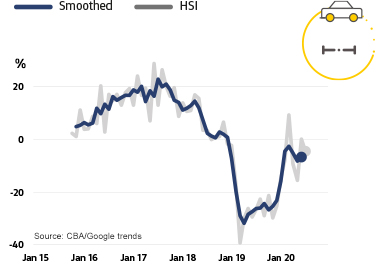
Motor Vehicles Spending Intentions
- Motor vehicle buying intentions have been tracking largely sideways in recent months and this continued into July.
- Goggle searches for motor vehicles were down marginally in July, but with actual spending up marginally on the month.
- Motor vehicle spending intentions remain well above the lows seen through much of 2019.
Health & Fitness Spending Intentions
- The pace of improvement in health & fitness spending intentions declined further in July, with the largest source of weakness in commercial and professional sports clubs and sports promotors. Other areas of softness included medical laboratories.
- Areas of strength in health & fitness spending remain for sports apparel, bicycle shops, public golf courses and sporting goods stores.
- Spending increases were also seen in chiropractic, dentists, optometrists and podiatrists.
Notes for Editors:
About our monthly Household Spending Intentions series
The HSI series offers a forward-looking view by analysing actual customer behaviour from CBA’s transactions data, along with household search activity from Google Trends.
The approach focuses on Australian households and their spending intentions. Employing near real-time spending readings from CBA’s household transactions data and combining them with relevant search information from Google Trends was used to map the data results on consumer spending. Households are the dominant part of the economy and drive much of its activity and volatility, and this combination adds to insights on prospective household spending trends in the Australian economy.
Google Trends is a publically available service that enables people to explore search trends around the world. These searches provide insights into what consumers are doing/researching on the Internet and what their spending intentions are.
CBA’s Household Spending Intentions series is published on the third Tuesday of every month. To find out more about the series, visit www.commbank.com.au/spendingintentions.
Disclaimer
The ‘CBA Household Spending Intentions’ series and “CBA credit and debit card spend” reports provide general market-related information, and are not intended to be an investment research report. These reports have been prepared without taking into account your objectives, financial situation (including the capacity to bear loss), knowledge, experience or needs. Before acting on the information in these reports you should consider the appropriateness and, if necessary seek appropriate professional or financial advice, including tax and legal advice. The data used in the ‘CBA Household Spending Intentions’ series is a combination of the CBA Data and Google Trends™ data. Google Trends is a trademark of Google LLC. Where ‘CBA data’ is cited, this refers to the Bank proprietary data that is sourced from the Bank’s internal systems and may include, but not be limited to, credit card transaction data, merchant facility transaction data and applications for credit. The Bank takes reasonable steps to ensure that its proprietary data used is accurate and any opinions, conclusions or recommendations are reasonably held or made as at the time of compilation of this report. As the statistics take into account only the Bank’s data, no representation or warranty is made as to the completeness of the data and it may not reflect all trends in the market. All customer data used or represented in this report is anonymous and aggregated before analysis and is used and disclosed in accordance with the Commonwealth Bank Group’s Privacy Policy Statement.
Commonwealth Bank of Australia ABN 48 123 123 124 AFSL 234945.
Full disclosures and disclaimers.