Monthly Household Spending Intentions – November 2020
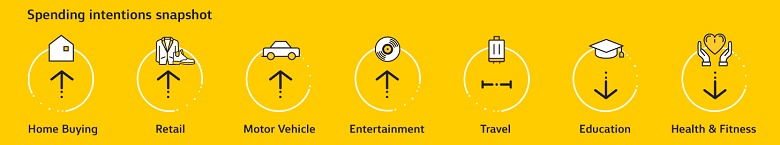
Each month, analysis by CBA’s Global Economic and Markets Research team provides an early indication of spending trends across seven key household sectors in Australia. In addition to home buying, the series covers around 55 per cent of Australia’s total consumer spend across; retail, travel, education, entertainment, motor vehicles, and health and fitness.
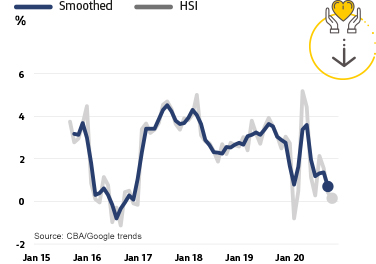
Home Buying Intentions
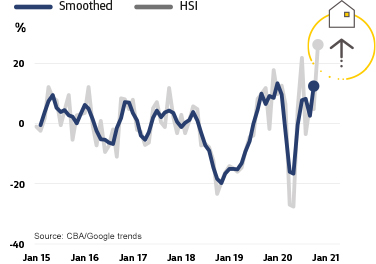
- Home buying spending intentions jumped higher in November, consistent with our expectations that the improvement in the Australian economy and the further interest rate cuts associated with the RBA’s November easing of monetary policy would see a restrengthening of the home buying market.
- While the number of Google searches related to home buying actually declined in November, the number of home loan applications jumped solidly in the month.
- The improvement in Home buying spending intentions has also led to a rise in house prices, which were up 0.7%/mth in November (based in CoreLogic data) and up 2.4%/yr.
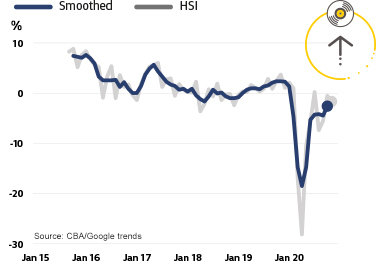
Retail Spending Intentions
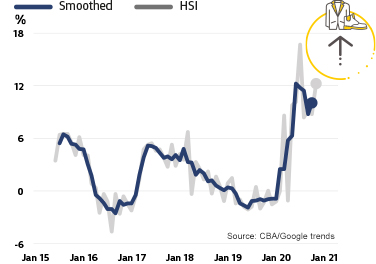
- Retail spending intentions rose in November – consistent with the lifting of restrictions in Victoria and our credit/debit card spending data. The increase came in both actual spending activity and Google searches.
- November showed improvement in spending on clothing and footwear, general retail, household furnishings and equipment, personal care and recreation spending.
- November saw very strong increases on an annual rate for spending on clothing, bakeries, grocery stores & supermarkets, department stores, furniture, flooring & upholstery stores, paint and hardware stores, household appliances, art & craft supplies, book stores, digital apps, electronic stores, florists, hobby stores, pet shops and record stores.
Travel Spending Intentions
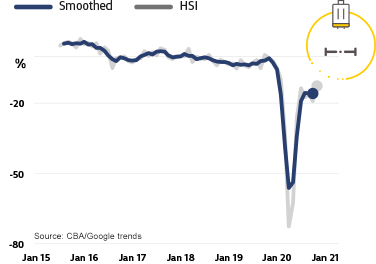
- Travel spending intentions tracked largely sideways in November, with some hints of improvement as state borders reopen.
- While Google searches for travel related spending declined in November, there was some improvement in actual spending in November 2020 compared with November last year. This included spending on aquariums, camping & recreational trailer dealers and trailer parks & camp grounds.
- Weakness is still evident in spending on many travel related sectors, such as airlines, hotels, motels & resorts, cruise ships, travel agencies, car rentals and bus lines. We would expect this to change as capacity returns to air travel and as confidence builds that states borders are open and will remain so.
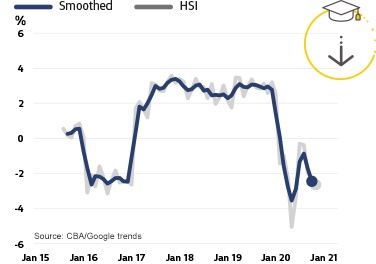
Health and Fitness Spending Intentions
- Health and fitness spending intentions declined in November, led lower by Google search activity. Actual spending activity was up on the month.
- Spending activity was up in November this year vs last year, with gains seen in sports apparel, chiropractors, dentists, doctors, hospitals,
- optometrists and podiatrists. Strong gains also continue to be seen in bicycle shops – sales and repairs, public golf courses and sporting goods stores.
- Spending remains soft for ambulance services (which is a good thing) and professional sports clubs.
Entertainment Spending Intentions
- Entertainment spending intentions were marginally stronger in November. While Google searches were flat on the month, actual spending increased a little.
- The strongest increases in spending in the year to November were seen in off-premise alcohol, eating out/restaurants, fast food restaurants, boat rentals, bowling alleys, pay TV, digital books/movies/music/games, music stores and video games.
- This category is benefiting from the easing of restrictions which have lifted capacity at entertainment venues.
- Weakness is still evident in spending on live music, billiards/pool establishments, dance halls/studies/schools, movie theatres and live performance theatres. We could see some improvement in these areas as capacity restrictions are eased.
Education Spending Intentions
- Education spending intentions declined further in November. While the number of transactions increased in November, Google searches were lower on the month and the value of transactions only slightly changed on an annual basis.
- For November 2020 vs November 2019, there was a large increase in the value of transactions for business & secretarial schools and a smaller increase in elementary and secondary schools. The value of spending on colleges & universities, correspondence schools and trade & vocational schools was down in the year to November.
Motor Vehicle Spending Intentions
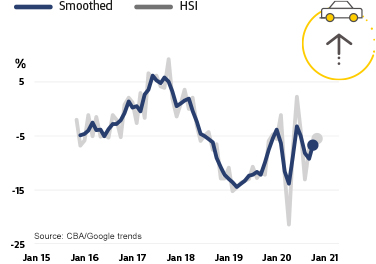
- Motor vehicle spending intentions improved in November. While the number of Google searches declined marginally, actual spending on motor vehicles and personal loan applications to purchase a motor vehicle both increased on the month. We have seen car imports lift in recent months as well.
- The ongoing improvements in the housing sector should help the outlook for the motor vehicle sector. Generally, spending on motor vehicles has the highest response to changes in property prices according to research published by the RBA.
- Working against this trend is the increasing shift to work-from-home.
Notes for Editors:
About our monthly Household Spending Intentions series
The HSI series offers a forward-looking view by analysing actual customer behaviour from CBA’s transactions data, along with household search activity from Google Trends.
The approach focuses on Australian households and their spending intentions. Near real-time spending readings from CBA’s household transactions data was combined with relevant search information from Google Trends to map the data results on consumer spending. Households are the dominant part of the economy and drive much of its activity and volatility, and this combination adds to insights on prospective household spending trends in the Australian economy.
Google Trends is a publically available service that enables people to explore search trends around the world. These searches provide insights into what consumers are doing/researching on the Internet and what their spending intentions are.
CBA’s Household Spending Intentions series is published on the third Tuesday of every month. To find out more about the series, visit www.commbank.com.au/spendingintentions.
Disclaimer
The information contained in this media release is published solely for informational purposes and provides general market-related information, and is not intended to be an investment research report. This media release has been prepared without taking into account your objectives, financial situation (including the capacity to bear loss), knowledge, experience or needs. Before acting on the information in this media release, you should consider its appropriateness and, if necessary, seek appropriate professional or financial advice, including tax and legal advice. The data used in this media release is a combination of ‘CBA transaction data’ and Google Trends™ data. Google Trends is a trademark of Google LLC. The term ‘CBA transaction data’ refers to the proprietary data of the Commonwealth Bank of Australia ("the Bank") that is sourced from the Bank’s internal systems and may include, but is not limited to, credit card transaction data, merchant facility transaction data and applications for credit. The Bank takes reasonable steps to ensure that its proprietary data is accurate and that any opinions, conclusions or recommendations are reasonably held, or are made at the time of compilation of this media release. As the statistics take into account only the Bank’s data, no representation or warranty is made as to the completeness of the data and it may not reflect all trends in the market. All customer data used or represented in this media release is anonymous and aggregated before analysis, and is used and disclosed in accordance with the Bank’s Privacy Policy Statement.
Commonwealth Bank of Australia ABN 48 123 123 124 AFSL 234945.
Full disclosures and disclaimers.