Financial and regulatory ratios

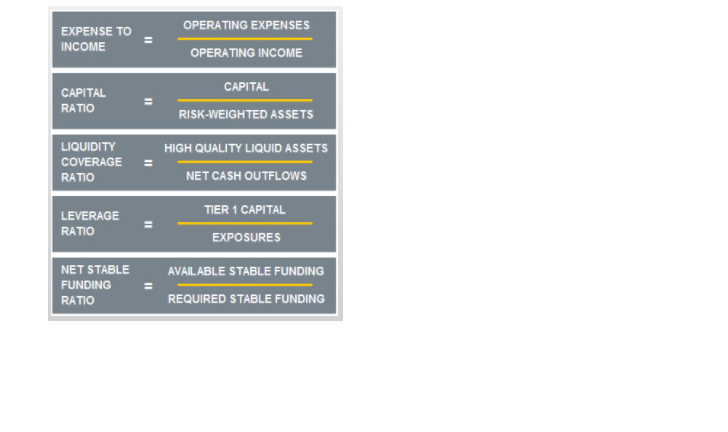
A number of ratios can be monitored to understand a bank’s financial position. Five relevant ratios are: 

This information is available in a bank’s annual reports, any relevant prospectus and other financial disclosures. 

5 relevant ratio equations

Expenses to income ratio

    • This ratio represents the bank's operating expenses as a percentage of operating income
    • A lower ratio indicates that more operating income may be available to pay bank hybrid security interest and repay the face value. For example, if the bank's ratio is 46%, this means that, for every $1 of operating income it has operating expenses of $0.46
    • If the ratio is too high, it may indicate that there may be a risk that the bank may not be able to repay the face value

Capital ratio

    • A bank's capital ratio represents the amount of capital the bank holds against risk-weighted assets
    • A higher capital ratio indicates the bank's strength which is critical to its ability to refinance its debt. For example, if the bank's Common Equity Tier 1 capital ratio is 10.00%, this means that, for every $1 of risk-weighted assets, it holds $0.10 of equity
    • If the ratio is too low, it may indicate that the bank may not be strong enough to repay the face value of bank hybrid securities
    • A low ratio may also cause the bank to breach a capital level trigger which may exchange the bank hybrid securities into ordinary shares

Liquidity coverage ratio

    • A bank's liquidity coverage ratio represents the amount of liquid assets the bank holds against net cash outflows projected under a 30 day stress scenario
    • A higher ratio indicates the bank's ability to repay its short term liabilities, including deposits, when they fall due. For example, if the bank's liquidity coverage ratio is 120%, this means that, for every $1 of net cash outflows projected under a 30 day stress scenario, it holds $1.20 of liquid assets
    • If the ratio is too low, it may indicate a risk that the bank may not be able to repay the face value

Leverage ratio

    • A bank's leverage ratio represents the amount of Tier 1 capital the bank holds against its exposures
    • A higher ratio is an indicator of the bank’s financial strength which is important to the bank’s ability to refinance debt. For example, if the bank’s leverage ratio was 5%, this means that, for every $1 of exposure, it holds $0.05 if Tier 1 capital
    • If the ratio is too low, it may indicate that the bank may not be able to repay the face value

Net stable funding ratio

    • A bank's net stable funding ratio represents the amount of stable funding held by the bank against its core assets
    • A higher ratio is an indicator of the bank’s financial strength which is important to the bank’s ability to refinance debt. For example, if the bank’s net stable funding ratio was 110%, this means that, for every $1 of core assets, it holds $1.10 of stable funding
    • If the ratio is too low, it may indicate that the bank may not be able to repay the face value

Things you should know

  • The information in this module is not investment advice and has been prepared without taking into account your investment objectives, financial situation or particular needs (including financial and taxation issues). If you have any questions, you should seek advice from your financial adviser or other professional adviser.