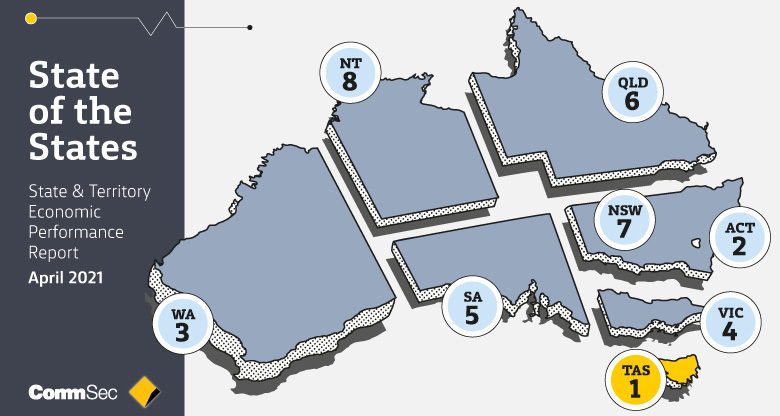
This is the fifth consecutive quarter that the island state has held the mantle of Australia’s best performing economy. The ACT was also an outperformer, coming in a clear second while Western Australia was a key mover, moving from sixth to third. There’s little separating Western Australia from New South Wales in seventh position.
Eight key indicators are assessed. They are:
- Economic growth
- Retail spending
- Equipment investment
- Unemployment
- Construction work done
- Population growth
- Housing finance
- Dwelling commencements
So how did each state and territory fare?
- Tas – Strength: Relative population growth; Weakness: Housing finance
- ACT – Strength: Relative unemployment; Weakness: Relative population growth
- WA – Strength: Relative unemployment; Weakness: Construction work
- Vic – Strength: Housing finance; Weakness: Relative population growth
- SA – Strength: Relative population growth; Weakness: Relative economic growth
- Qld – Strength: Housing finance; Weakness: Equipment investment
- NSW – Strength: Construction work; Weakness: Dwelling starts
- NT – Strength: Equipment investment; Weakness: Relative population growth
CommSec chief economist Craig James analyses the results by each measure.
Relative economic growth
We looked at nominal state final demand plus trade with rolling annual totals used to remove seasonality. Leading in relative economic growth is the ACT followed by Western Australia and Tasmania. Economic activity in the ACT to the year to December was just under 22% above its normal decade average of output. Plus, the ACT had the fastest nominal economic growth at 5.2%.
Retail Spending
To assess retail spending, we use real or inflation-adjusted retail trade in seasonally adjusted terms for the December quarter and compare it with decade averages. On top is the ACT where retail spending was 19.4% above decade average levels in the December quarter. Tasmania slipped to second and Queensland came in third.
Equipment Investment
For this indicator, we analyse spending on plant and equipment and compare December quarter data with the decade average. On this measure Tasmania leads the way from the NT and the ACT. All economies recorded spending in the quarter above decade averages.
Relative unemployment
We look at the latest March unemployment rates across state and territory economies and compare the rates with decade averages. Currently, the ACT has the strongest job market in the nation from Western Australia and Tasmania. Unemployment in the ACT stands at 3.4% which is 14.8% below the decade average.
Construction work
For this measure, we look at the total real value of residential, commercial and engineering work completed in seasonally adjusted terms in the December quarter and track it against the decade average. Victoria has retained top spot with construction work done now 17.5% above its decade average. Tasmania was next strongest, ahead of NSW in third spot.
Relative population growth
Here we track the current annual population growth and compare it with each economy’s decade average or “normal” growth pace. On this basis, Tasmania remains well in front. Its near 1% population growth is almost 62% above the decade average. It’s also worth noting that Queensland has the fastest annual population rate at the moment at 1.33%.
Housing finance
For this indicator, the value of owner-occupier housing finance commitments (or home loans) is compared with the decade average for each economy. Victoria is now in top spot for this measure with the value of home loans up by 87.7% on the long-term average. Next strongest is Queensland followed by Tasmania.
Dwelling starts
Here we look at dwelling commencements in the December quarter and compare it to the decade average level. Leading the way is Tasmania, underpinned by a solid population growth. Next is WA supported by home builder schemes and South Australia is in third position.
Read the full report. Plus, you’ll find more economic articles at CommBank Foresight, insights for future-facing businesses.

